 Goblin
 lives in your menu bar as one item. It can be a small icon, one live figure such as your CPU load, a tiny graph, or several figures side by side. Clicking it opens the menu bar panel. This page covers how the item looks, what every part of it means, and how to get it back if it goes missing. Everything about its looks is in Settings›Menu Bar.
Open the menu bar settings#
- Click Goblin's item, then click the gear at the bottom of the panel. Or right-click the item and choose Settings… (⌘,).
- In the sidebar, click Menu Bar.
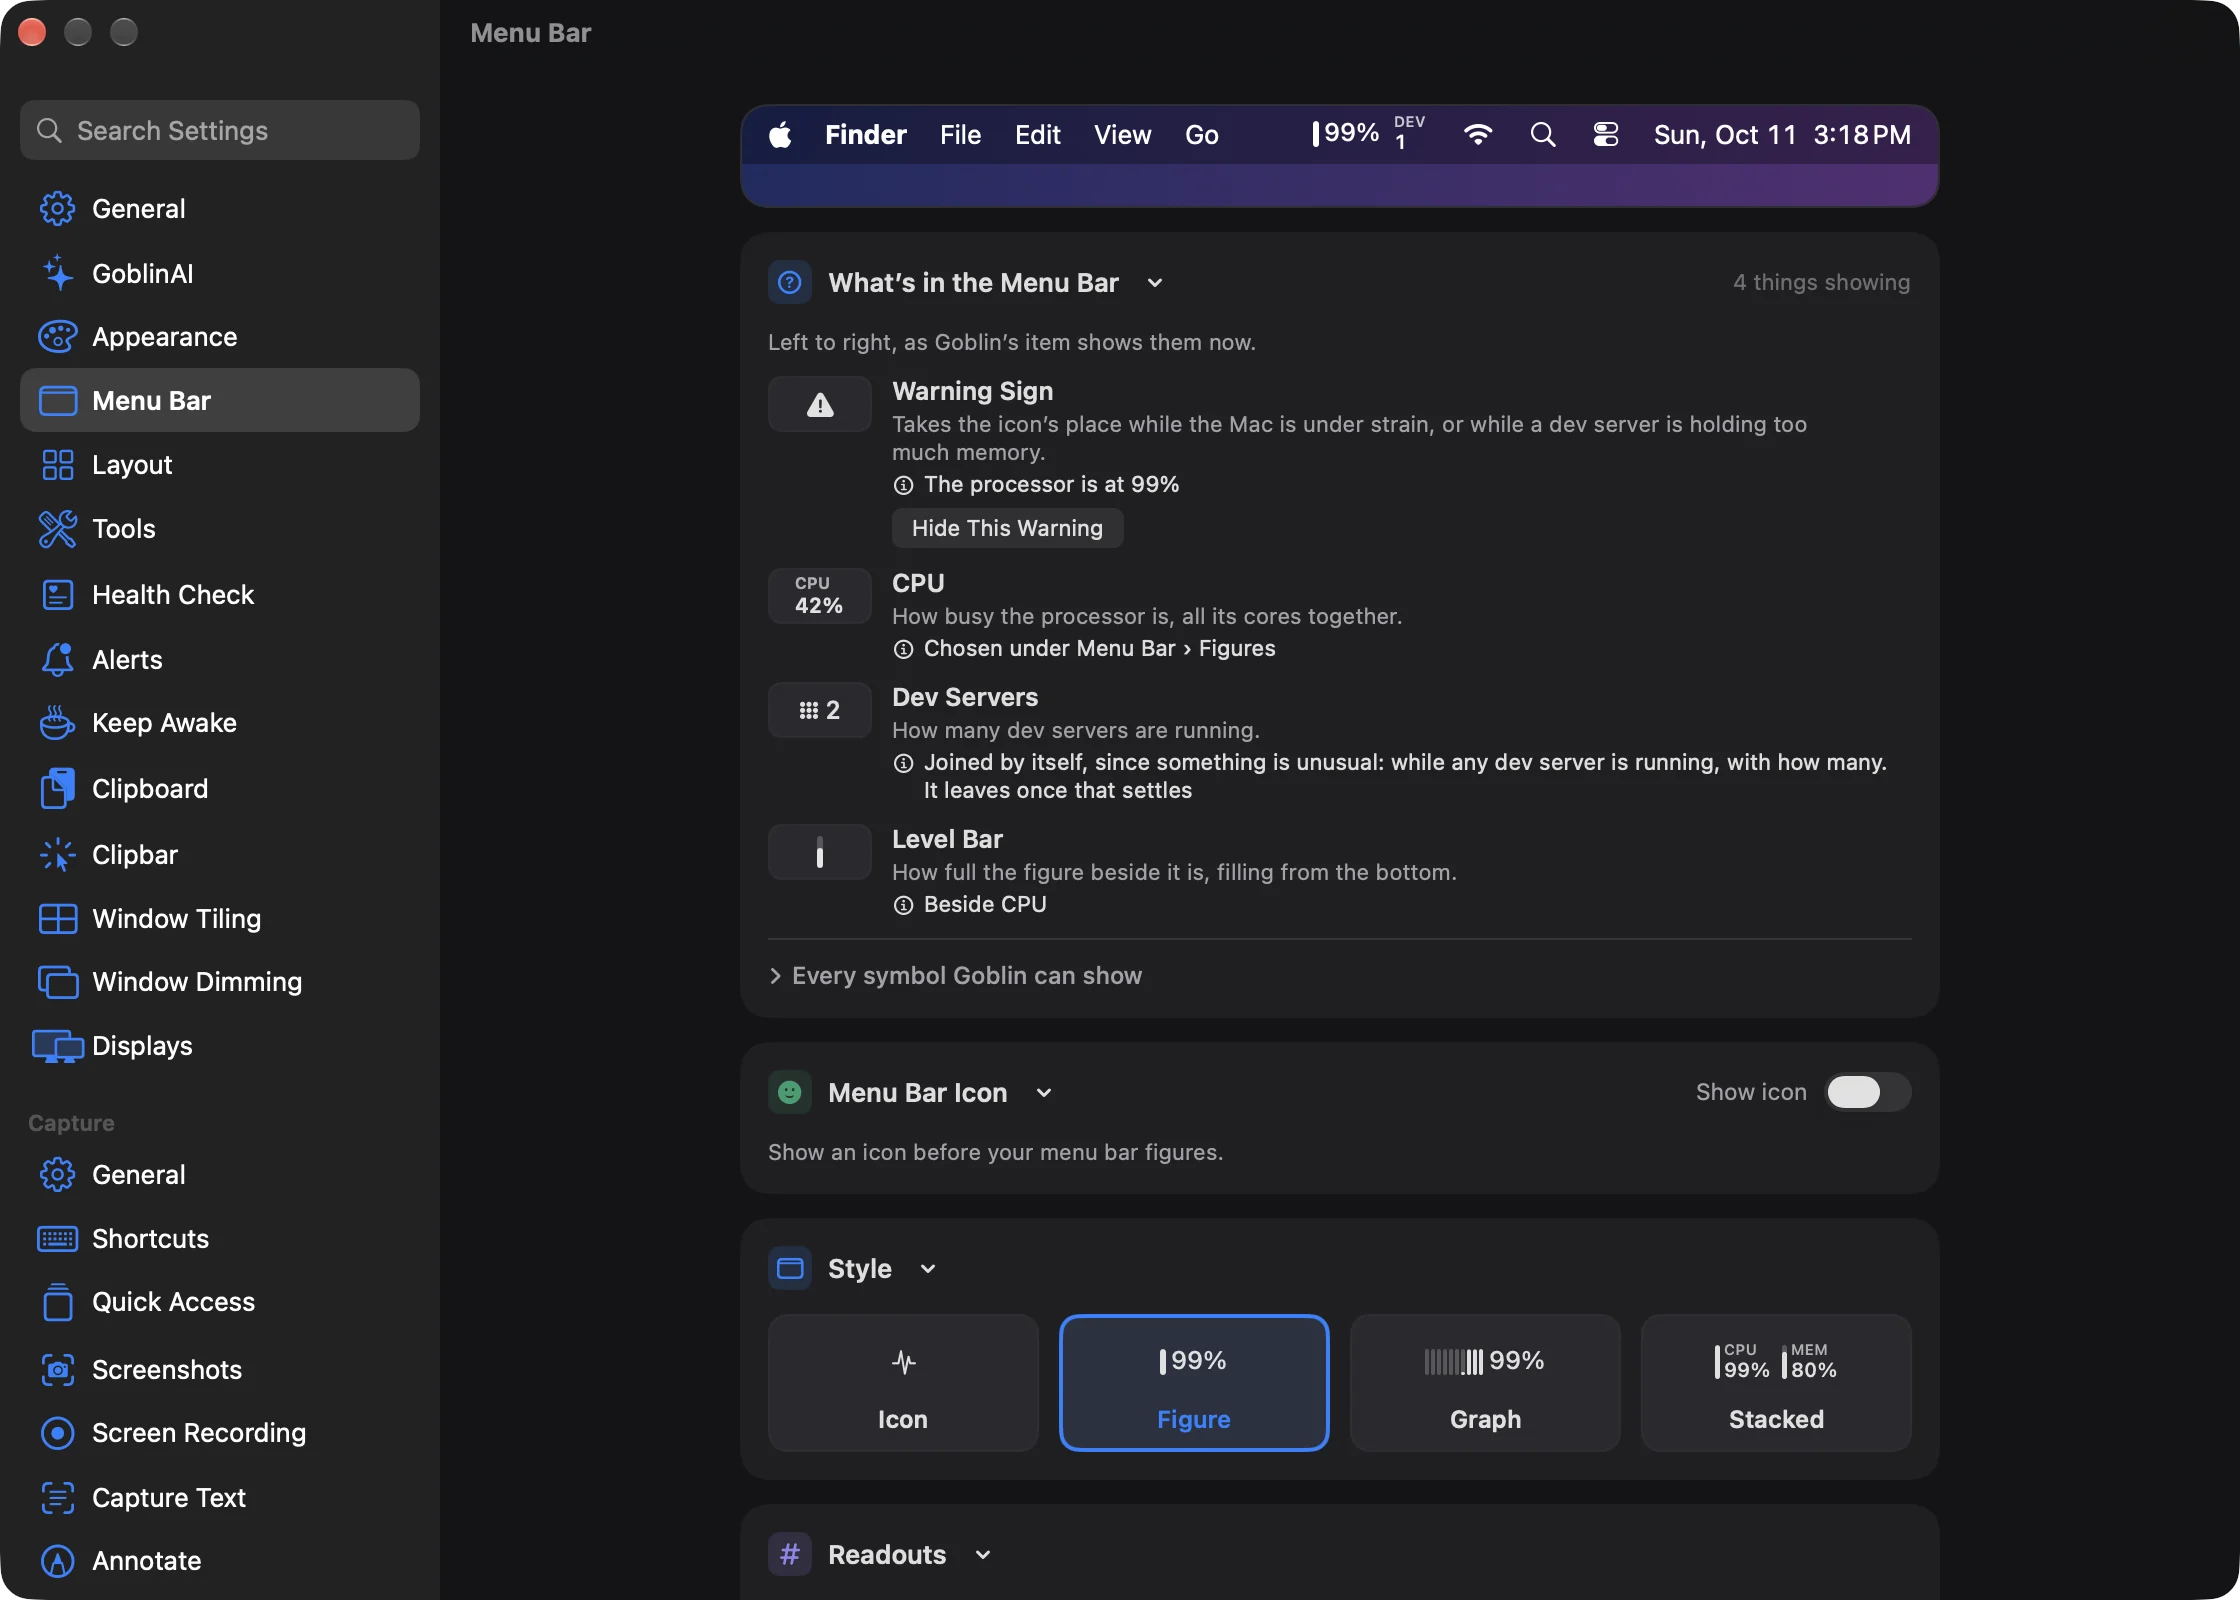
At the top of the pane a pretend menu bar shows Goblin's item drawn from your live figures. Every change you make shows there first.
You chose a first look in the welcome window when Goblin started for the first time (see Installing Goblin). You can change it here at any time.
What the item shows, left to right#
- The icon, when it's on: the Pulse (a heartbeat line) or the Goblin's face. A warning sign takes its place while the Mac is under strain (see Turn the warning sign off).
- The Keep Awake icon, while a Keep Awake session runs (see Keep Awake in the menu bar).
- Firewall cues, when the firewall is on: the inactivity warning, the Silent Allow tick or Silent Deny cross, and the grey "blocked" bars (see Firewall cues).
- Your figures, drawn in the style you chose.
- Automatic figures that joined because something is unusual. These are always drawn as a small label over its value. See Automatic figures.
- Firewall traffic rates, data sent over data received, if you turned them on.
The item keeps its width as numbers change, so it doesn't push the rest of your menu bar around. It reserves room for a usually wide value, such as "99%" or "↓ 99.9 MB/s". A reading of 100% can still widen it by one digit.
Normally the item is drawn in your menu bar's own color, like Apple's icons. Once anything in it is colored (colored readings, a colored firewall cue or rate, or the red flash), the uncolored parts are drawn white on a dark menu bar and black on a light one.
The item updates every 5 seconds while no Goblin window or panel is open, every 2 seconds while the panel is open, and every second while the main window is open. It's only redrawn when a rounded value changes.
My menu bar item is hidden#
macOS gives the menu bar only so much room. When it runs out, as it does on a Mac with a notch or with many apps' items, macOS hides the items that don't fit, and Goblin's can be one of them. You can also hide an item yourself by dragging it out with ⌘. While Goblin's item is hidden, Goblin keeps working: its alerts still appear (see What happens while the item is hidden).
To get the item back:
- Open Goblin from your Applications folder, Launchpad or Spotlight. Goblin is already running, so this opens its window instead of starting a second copy.
- Press ⌘, to open Settings, then click Menu Bar.
- Make the item narrower (see Make the item narrower), so it fits in the room macOS has.
- If Separate Items is on, click Back to One Item. Each separate item needs room of its own.
- Make room by quitting apps whose menu bar items you don't need, or by holding ⌘ and dragging items to rearrange them.
If macOS still doesn't show it, look in System Settings›Menu Bar (on versions of macOS that have it) and make sure Goblin is allowed to show an item. A menu bar manager app can also hide Goblin's item.
Until it is back, you can reach everything another way:
- Open the window with Open window from any app (⌥⌘S), or open the panel with Open dropdown from any app (⌥⌘P). Both are in Settings›General›Keyboard Shortcuts and are off until you turn them on. See Keyboard shortcuts. If the item has been taken out of the menu bar altogether, the dropdown shortcut opens the window on the panel's tab instead.
- Turn on Show in Dock in Settings›General, and click Goblin's Dock icon to open its window.
Tip: Show less in the item and it hides less often. The Icon style is the narrowest, and Compact menu bar size shrinks any style.
What happens while the item is hidden#
Goblin's alert dropdowns (an app that stopped responding, memory running short, a big Trash, a shortcut clash) normally hang from its item. When the item isn't in the menu bar, they hang from the right end of the menu bar on your main screen instead, so they're never lost off the edge of the screen. The exception is the offer to uninstall an app you moved to the Trash, which needs the item; without it Goblin makes that offer with its farewell card or a notification.
Choose what the item shows#
- Open Settings›Menu Bar.
- In the Style card, click a tile: Icon, Figure, Graph or Stacked. Each tile is a live preview of your own figures.
- For Figure, Graph or Stacked, choose the figures in the Figure (or Figures) card (see Pick the figures).
- Check the pretend menu bar at the top of the pane. The real item changes as you click.
| Style | What the item shows |
|---|---|
| Icon | The icon alone, plus firewall cues, the Keep Awake icon and any automatic figures. It always shows an icon. |
| Figure | One figure, with a thin level bar beside it when the figure has a top (such as CPU at 100%). The default, showing CPU. |
| Graph | A small graph of recent readings for one figure, then its value. |
| Stacked | Several figures side by side, each a small label over its value with a thin level bar. CPU and Memory to start with. |
While separate items are on, the Goblin item shows only its icon, and the Style card says so. Your style comes back when you return to one item.
In Graph style, the Dev Servers figure has no graph: it shows its symbol and the count.
The key: What’s in the Menu Bar#
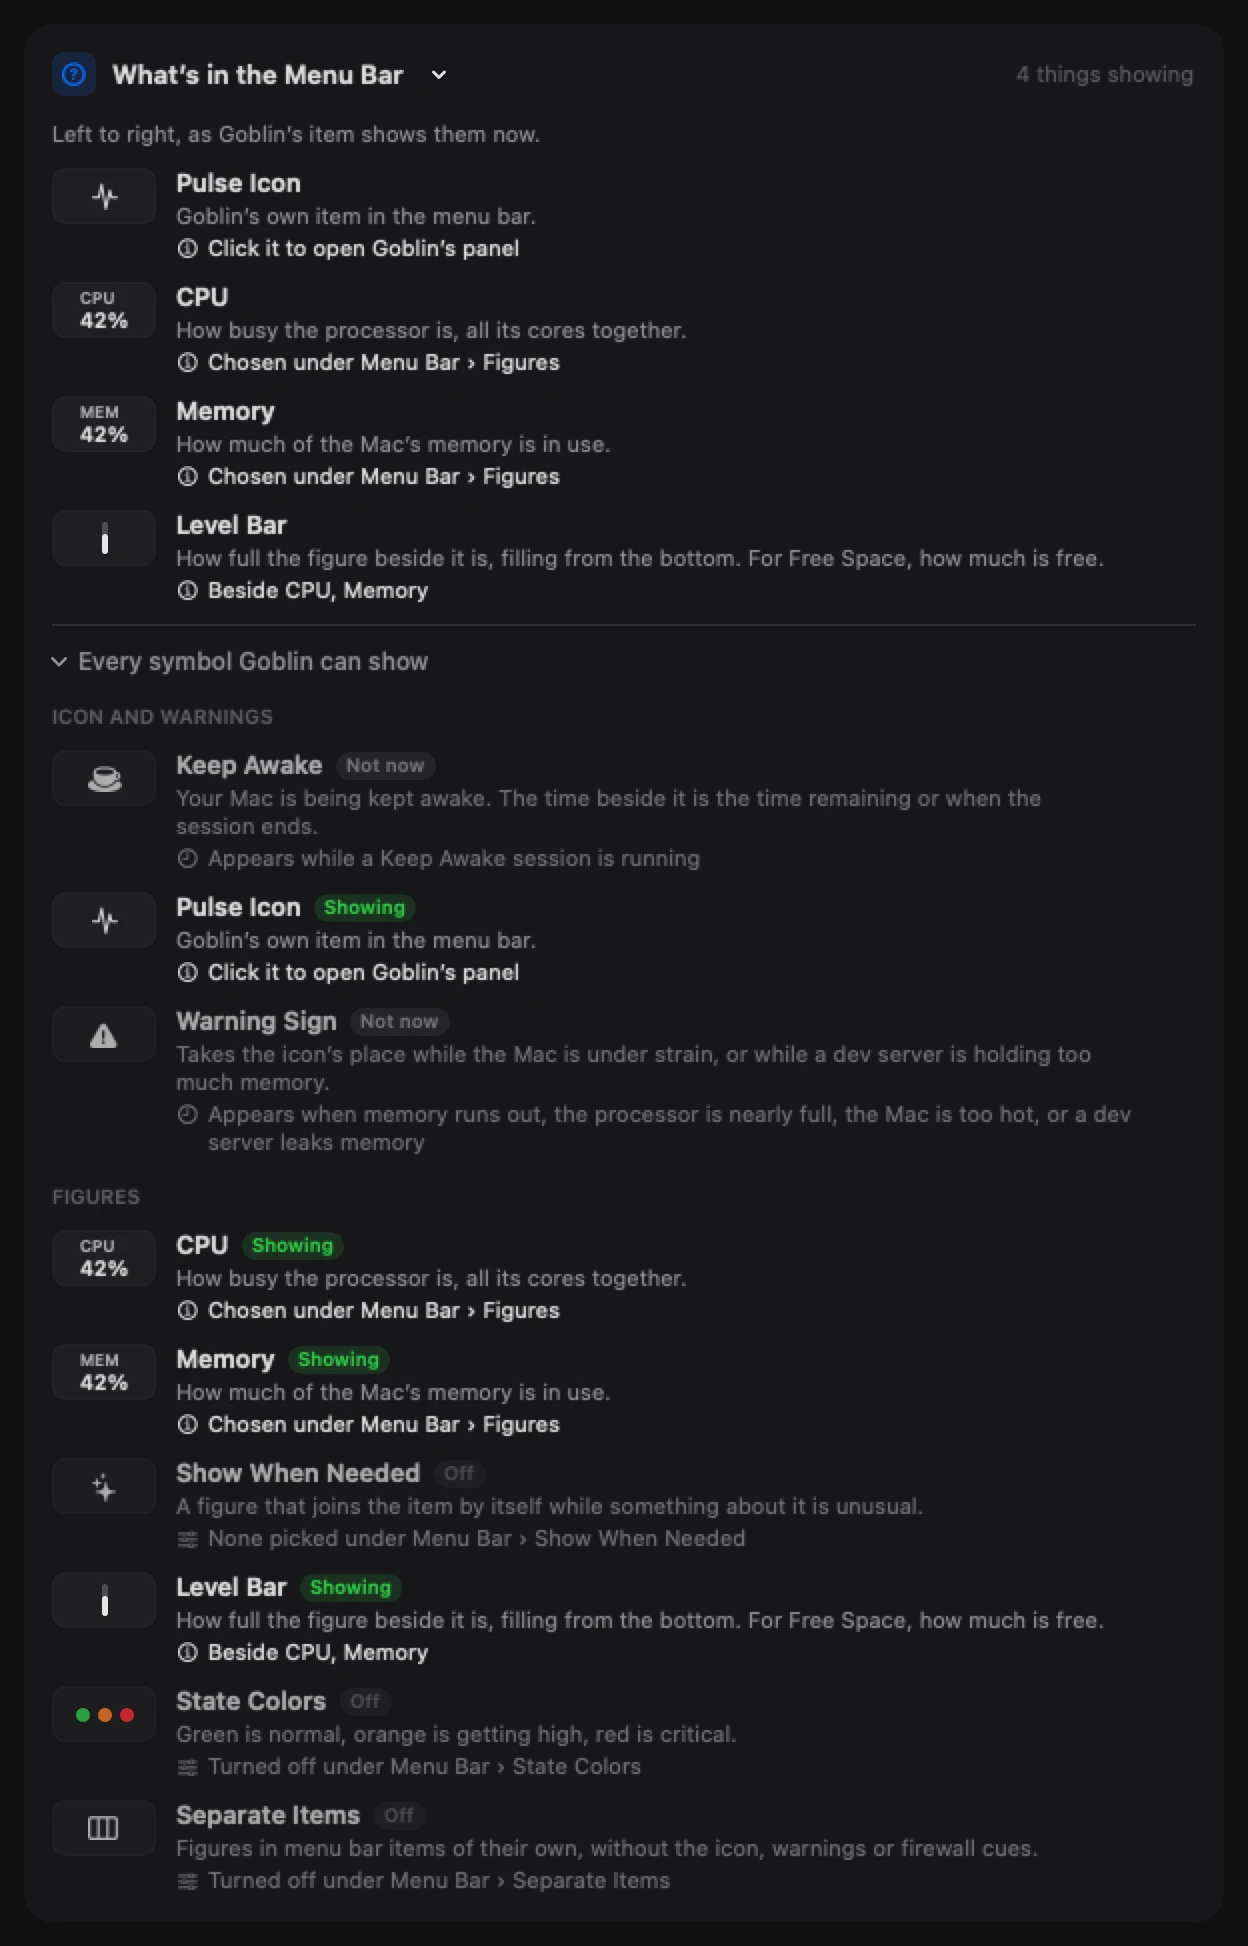
Under the pretend menu bar, the What’s in the Menu Bar card is a live key. It lists every symbol that is showing, left to right, with what it means and why it's there. A header note counts them, for example "3 things showing".
New: Coming in the next update. Keep Awake joins the menu bar key.
The Keep Awake row shows your chosen session icon, the running session and its time, or why the indicator is waiting or turned off. It appears here even when you use a separate Keep Awake menu bar item.
Some rows have a button so you can act on the spot:
- Turn Filtering On on the Filtering Off cue. If your firewall rules are locked, it asks you to authenticate.
- Hide This Warning on the Filtering Off cue (sets Inactivity Warning to Off) or on the warning sign (turns the warning sign off).
- Hide This Symbol on the Silent Allow or Silent Deny cue (sets Silent Mode to Off).
To see all of them, click Every symbol Goblin can show. They're grouped under ICON AND WARNINGS, FIGURES and FIREWALL, each with a badge: Showing, Not now or Off. The firewall group appears only while the firewall is on or its network extension is running. Goblin remembers whether you left the list open.
Note: The key's State Colors row says "Turned off under Menu Bar › State Colors" when readings aren't colored by thresholds. That setting is now in the Graph Colors and Thresholds card (see Color the figures).
Show or hide the icon#
- Open Settings›Menu Bar.
- In the Menu Bar Icon card, turn Show icon on or off.
- When it's on, click a tile to pick the icon: Pulse (a heartbeat line) or Goblin (the Goblin's face). Both are monochrome and follow your menu bar's appearance.
| Setting | What it does | Default |
|---|---|---|
| Show icon | Draws an icon before your figures. Turn it off to show figures only. | Off |
| Pulse / Goblin | Which icon to draw. | Pulse |
The Icon style always shows an icon, so the switch is greyed out there. With the icon turned off, the warning sign still appears when it's needed.
Note: A fresh copy of Goblin starts with the icon off, so the item is a CPU figure and nothing else. Turn Show icon on if you want the icon back. Applying the built-in Today preset also turns it on.
Readouts#
| Setting | What it does | Default |
|---|---|---|
| Compact menu bar size | Draws the whole item smaller: 82% of the usual width and 18 instead of 22 points tall. Useful on a crowded menu bar. | Off |
| Show memory pressure instead of memory used | The Memory figure shows how hard macOS is working to find free memory, as a percentage, instead of how much memory is in use. Its label becomes "PRESS" and its graph follows pressure. | Off |
| Show upload beside download | In Figure and Graph styles the Network figure reads "↓ 1.2 MB/s ↑ 34 kB/s". Turn it off for download only. | On |
Memory pressure is often the better measure on a Mac, since macOS fills spare memory with caches on purpose. A high "used" figure on its own is normal. Stacked style always shows both network directions, upload over download.
Make the item narrower#
To fit a crowded menu bar, do any of these in Settings›Menu Bar. Each makes the item smaller:
- Turn on Compact menu bar size in the Readouts card.
- Choose fewer figures in the Figure or Figures card, or choose the Icon style in the Style card.
- In the Labels and Precision card, leave Name before the value off and turn on Hide the % and ° signs.
- Turn off Show upload beside download in the Readouts card, so the Network figure shows download only.
Pick the figures#
This card is called Figure in the Figure and Graph styles, where you pick one, and Figures in Stacked style, where you pick several. Each chip shows the figure's live value, or "—" if this Mac can't measure it. In the Icon style the chips are greyed out, with the note "Not shown with the Icon style".
To change the figure in Figure or Graph style:
- Open Settings›Menu Bar and find the Figure card.
- Click a chip. The item changes at once.
| Chip | What the item shows | Label in Stacked | Level bar |
|---|---|---|---|
| CPU | Whole-Mac processor load, "23%" | CPU | Yes, 0–100% |
| Memory | Memory in use, "61%" (or pressure) | MEM (PRESS) | Yes |
| GPU | Graphics load, "12%" | GPU | Yes |
| Network | Download and upload speed, every app together | NET | No |
| CPU Temp | Processor temperature, "54°" | CPU° | Yes, 20–105 °C |
| GPU Temp | Graphics processor temperature | GPU° | Yes, 20–105 °C |
| Battery | Battery charge, "87%" | BAT | Yes |
| Dev Servers | How many dev servers are running, beside a dot-grid symbol | DEV | No |
| Disk | Disk reading and writing, "R 1.2 MB/s W 300 kB/s" | DSK | No |
| Free Space | Free space on the startup disk, "412 GB" | FREE | Yes, the free share |
| Fan | The fastest fan's speed, "1200 rpm", or "Off" | FAN | Yes, against the fan's top speed |
| Power | What the whole Mac is drawing, "12.3 W" | PWR | No |
- Network speeds are in bytes or bits per second, as set under Settings › General. Temperatures follow your Celsius or Fahrenheit choice there too. Disk activity is always in bytes.
- Free Space counts in decimal units, the way Finder does, so "1.82 TB" matches Finder's figure. Its level bar fills with the free share, so a full bar means plenty of room.
- A figure shows "–" before its first reading, and on Macs without that hardware: GPU with no reading, Battery without a battery, Fan on a fanless Mac.
- Power uses the Mac's own power sensor when it has one, and otherwise what the battery is drawing.
Pick several figures (Stacked style)#
- In the Style card, click Stacked.
- In the Figures card, click a chip to add it at the end. Click it again to take it out. A number on its corner shows its place.
A meter in the card's header reads, for example, "2 of 4". The item always keeps at least one figure. When the list is full, a chip's tooltip tells you to turn one off or raise the limit in Order.
Reorder the figures (Stacked style)#
The Order card shows one tile per chosen figure, in order. It appears only in Stacked style.
- Drag a tile to its new place. Or right-click it and choose Move Earlier or Move Later. With a tile focused, ⌘← and ⌘→ move it.
- To hold more or fewer figures, change Most figures at once, from 1 to 6. The default is 4. Lowering it removes the figures past the new limit from your list.
More figures make the item wider.
Color the figures#
The Graph Colors and Thresholds card (subtitled "Menu bar and app charts") controls colors in two places: the charts inside Goblin, and the readings in the menu bar item. Everything is off until you choose it.
To color the menu bar readings:
- Open Settings›Menu Bar and find the Graph Colors and Thresholds card.
- Next to Menu bar readings, choose Off, Fixed colors, Thresholds or Severity.
- For Thresholds or Severity, set the colors and the levels where they change (below).
| Choice | What it does |
|---|---|
| Off | Readings use the menu bar's own color. |
| Fixed colors | Each reading keeps its own color whatever its level. Pick a color for each reading, or leave the defaults. Reset reading colors puts them back. |
| Thresholds | A reading turns your Warning color, then your Critical color, when it reaches those levels. Switch on Use each reading’s color below thresholds to keep each reading's own color until then. |
| Severity | Four steps: Normal (green), Elevated (yellow), Warning (orange) and Critical (red), with a level for each. |
With Thresholds or Severity on, the card also offers:
- Normal, Elevated (Severity only), Warning and Critical color pickers, and Reset state colors. The Normal picker is greyed out while each reading keeps its own color below the thresholds.
- Tiles for what gets colored: Bar and value, Bar or Value. The default is Bar and value.
- A switch, Color the menu bar icon when the Mac is under strain. The icon takes the most serious color among your CPU, Memory, GPU, temperature, battery and free-space readings, even in the Icon style, and goes back to the menu bar's own color when they recover.
- Levels, set with the small arrows beside each number:
| Row | Warning from | Critical from | Elevated from (Severity) | Range |
|---|---|---|---|---|
| CPU, Memory, GPU, Disk Used | 70% | 90% | 50% | 1–100% |
| Temperatures | 70 °C | 90 °C | 60 °C | 20–120 °C |
| Battery | at or below 30% | at or below 15% | at or below 50% | 1–99% |
- Free Space uses the first row, measured on how full the disk is.
- Temperature levels are always set in °C, whatever unit the item shows.
- A battery that is charging always stays in the normal color.
- The arrows keep the levels in order, so Warning can never pass Critical.
- Network, Dev Servers, Disk, Fan and Power are never colored by level.
- Labels in Stacked style stay in the menu bar's own color.
- Colors change at once at these levels. Notification rules decide separately when an alert is sent.
Two more choices apply whatever you chose above:
- Menu bar graph sets one color for the graph in the Graph style. Automatic goes back to the default. Level colors take over the graph's bars while a color mode is on and Bar or Bar and value is chosen.
- App charts picks a color for each of CPU, Memory, Disk, Network, GPU and Battery in Goblin's charts, in the Overview, in the detail views and in the menu bar panel. Color-blind-friendly palette fills them in with a palette that is easier to tell apart, and Default chart colors puts them back.
Labels and precision#
| Setting | What it does | Default |
|---|---|---|
| Name before the value | Writes the figure's name first, "CPU 23%", in Figure and Graph styles. Stacked style already shows names. | Off |
| One decimal on percentages | Writes CPU, Memory, GPU and Battery percentages with one decimal place. | Off |
| Hide the % and ° signs | Writes "23" instead of "23%", and "54" instead of "54°". Saves a little room. | Off |
Graph#
These settings shape the graph in the Graph style, and in any separate item with Graph turned on.
To change the graph:
- Open Settings›Menu Bar and find the Graph card ("Applies to the Graph style").
- In Shape, Width and Height, click the tile you want. Each tile is a live preview.
| Setting | Choices | Default |
|---|---|---|
| Shape | Bars; Line, a smooth line over a faint baseline; Area, a line with a light fill under it | Bars |
| Width | Narrow (6 readings), Standard (10), Wide (16), Widest (24). Each reading is 3 points wide. | Standard |
| Height | Standard, each figure on its usual range; Fit to Recent, stretched between recent highs and lows | Standard |
On Standard height, CPU and GPU run from 0 to 100%, Memory and Battery are percentages, temperatures run from 30 to 100 °C, and Fan is measured against the fan's top speed. Network, Dev Servers, Disk and Power are drawn against their recent peak. Free Space is a flat line at how full the disk is.
Fit to Recent makes small changes stand out. It never stretches less than a 10% span, so tiny wobbles don't look like spikes.
A graph gains one reading at each update: every 5 seconds with nothing open, so a Standard graph covers about the last 50 seconds. While the panel or window is open it updates faster and covers less time. If Dev Servers is your figure, the previews in this card show CPU instead.
Turn the warning sign off#
The Warning Sign card (the last card in Settings›Menu Bar) has one switch.
| Setting | What it does | Default |
|---|---|---|
| Show a warning sign when the Mac is under strain | Swaps the icon for a warning triangle while the Mac is struggling. | On |
To turn it off, switch it off in that card. Or click Hide This Warning on the warning sign's row in the key.
The warning sign appears when any of these is true:
- macOS reports memory pressure as Critical;
- the processor is above 95% in total;
- macOS reports the Mac's thermal state as Critical, meaning it's slowing the Mac down to cool it;
- a dev server is holding too much memory, while the leak alert in Settings › Projects is on and you haven't muted or snoozed that server.
It replaces the icon even when Show icon is off, so you won't miss it. The key in What’s in the Menu Bar spells out the cause, such as "Memory is running out". Dev servers are checked about once a minute in the background, so a leak can take up to a minute to show. For what to do next, see Health and alerts.
Clicking the item#
- Click opens or closes the menu bar panel.
- Right-click or Control-click shows the item's menu (below).
- Command-drag moves the item along the menu bar. That's handled by macOS.
- Option-click does what you choose in the Clicks card (below).
- While a recording runs, a plain click shows a small menu with Stop Recording, Pause Recording and Show Dropdown. During a self-timer countdown, any click cancels it. See Menu bar and desktop.
When you drag files over the item, a compact menu offers actions for that selection. Drop on a tool, or release on the target first and choose an action afterward. You can also shake the pointer while dragging to show it. See Drop files on Goblin, including the Cancel drop area.
Change what Option-click does#
- Open Settings›Menu Bar and find the Clicks card.
- Next to Option-click, choose one of the options below. A line under the picker describes the choice.
| Option-click choice | What it does |
|---|---|
| Same as a click (default) | Opens the panel, like any click. |
| Open the window | Opens Goblin's window on the tab it last showed. |
| Open the window on the figure | Opens Goblin's window on the tab for the item's first figure. |
For Open the window on the figure: CPU, Memory, GPU and Network open their own tabs. Battery, CPU Temp, GPU Temp, Fan and Power open the Power tab (the temperature, fan and power figures open its Temperatures & Fans page). Dev Servers opens Projects, and Disk and Free Space open Disk. In the Icon style there's no figure, so the window opens on its last tab. Option-click works only with Option alone held. The same choice applies to separate items, but not to the Keep Awake item. A plain click, a right-click and a Control-click keep their usual jobs whatever you choose.
The right-click menu#
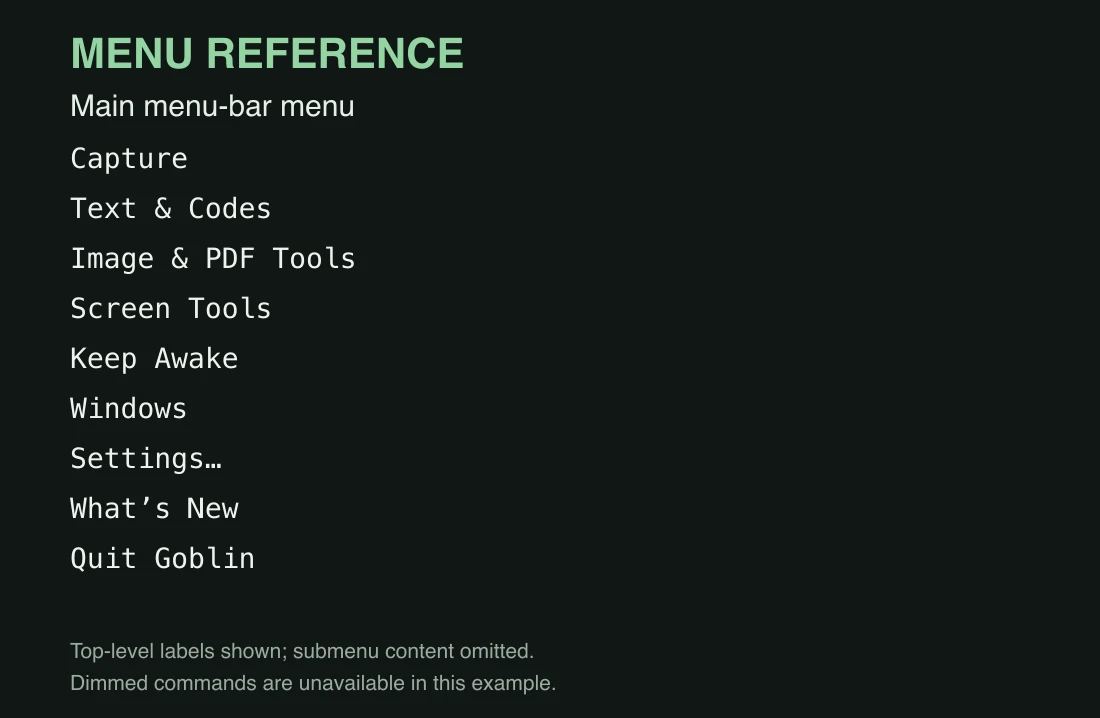
Right-click (or Control-click) the item. Any panel that's open closes, and a menu shows these things, top to bottom:
- The capture section, if Capture in the right-click menu is on (it is by default): Capture Area, Record Screen and the rest. See Menu bar and desktop.
- Keep Awake ›, to start, end and extend a session. See Keep Awake basics.
- Network ›, while the firewall is on (see below).
- Windows ›, with Window Tiling (while it's on) and Window Dimming, ticked while it's on.
- Settings… (⌘,) opens Goblin's Settings.
- What’s New shows what changed in recent versions.
- Quit Goblin (⌘Q) quits at once, without asking.
To quit Goblin from the menu bar, choose Quit Goblin. The Quit button at the bottom of the panel does the same.
The Network › submenu holds:
- Turn Filtering Off or Turn Filtering On, under the header Filtering.
- Alert, Silent Allow and Silent Deny, under Operation Mode, with the current mode ticked.
- Sound Rules, ticked while on.
- Profile ›, with No Profile and each of your profiles, if you have any.
- The last five minutes of traffic as a small chart. Click it to open Network›Connections.
- Recent Network Activity: up to three apps moving at least 1 kB/s, with their upload and download speeds, or "None right now".
- Recently Denied ›: up to 12 connections denied in the last 5 minutes, such as "Rules denying Safari → example.com (3×)". Each has a submenu of what denied it (a rule, a blocklist, or Silent Deny mode). Choosing one opens the Rules screen on that rule.
- Manage Rules…, Connections… and Firewall Settings….
Changing filtering, the mode or the profile may ask you to authenticate if your rules are locked. Sound Rules doesn't.
Firewall cues#
When the firewall is on, the item can show what it's doing. These settings live in Settings›Firewall›Status Menu, not in the Menu Bar pane. Every pane of the firewall is covered in Firewall settings.
| Setting | Choices | Default |
|---|---|---|
| Show firewall status in the menu bar | Turns all four cues below on or off together. | On |
| Numeric Traffic Rates: | Off, Monochrome, Colored. Data sent over data received, at the end of the item. Colored draws sent in purple and received in blue. | Off |
| Blocked Connections: | Off, Grey bars, Red flash. For 3 seconds after each denied connection, three grey bars rock, or the icon flashes red. | Off |
| Silent Mode: | Off, Outline, Colored. A tick in a circle in Silent Allow mode (green when colored), a cross in Silent Deny (red when colored). | Outline |
| Inactivity Warning: | Off, Outline, Colored. A warning sign while the network extension runs but filtering is off (yellow when colored). | Outline |
- If you had the older "flash on block" switch on, Blocked Connections starts as Red flash.
- Red flash recolors the icon, so it needs the icon showing. With Show icon off in the Figure, Graph or Stacked style, nothing visible flashes.
- The Silent Mode and inactivity cues appear only while the network extension is running. Traffic rates and blocked cues need only the firewall switched on.
- The Preview row in that card shows three samples: Silent Allow, Filter off and Blocked.
- The whole Firewall pane is greyed out while your rules are locked.
Keep Awake in the menu bar#
New in 1.1: An icon appears right after Goblin's icon while a Keep Awake session runs, optionally with the time left or the time it ends, and Keep Awake can have a menu bar item of its own.
The icon is a cup unless you pick another: Mug, Pill, Eye, Bolt, Sun, Moon or Light bulb. The end time follows the 12- or 24-hour Clock you choose. All of this is set in Settings›Keep Awake. See Keep Awake settings.
Where each card of Settings › Menu Bar is explained#
The cards run top to bottom in this order.
| Card | Page |
|---|---|
| What’s in the Menu Bar, Menu Bar Icon, Style, Readouts, Figure / Figures | This page |
| Show When Needed | Automatic figures |
| Order | This page |
| When Figures Appear | Automatic figures |
| Graph Colors and Thresholds, Labels and Precision, Graph | This page |
| Presets, Situations | Presets |
| Clicks | This page |
| Shortcuts | Keyboard shortcuts |
| Dropdown | The menu bar panel |
| Separate Items, Items | Separate items |
| Warning Sign | This page |