 Goblin
When an app misbehaves, its logs often say why. Goblin's log viewer shows what one app, process, project or macOS has written to the system log, plus its own log files and crash reports, in a window that's easier to read than Console. It reads the log for only the thing you picked, sorts it by importance, and lets you search, filter and watch it live.
Opening a log window#
- Open a tab with an app list, such as CPU (⌘2) or Memory (⌘3).
- Right-click the app (or a process inside it).
- Choose Show Logs.
A window opens with the entries from the last 15 minutes. The other places to start from:
| Where | Choose |
|---|---|
| Any app list (CPU, Memory, Disk, Network, GPU, or the Battery page of Power) | Right-click an app or a process › Show Logs |
| The App Inspector | Logs in the header, or right-click a process › Show Logs |
| The Projects tab | Right-click a project › Show Logs |
| The menu bar panel | Right-click an app › Logs, or a server's details › … › Show Logs |
| Inside a log window | Right-click an entry › Open Logs for \<process\>, or Process Logs in an opened entry |
For an app, the window covers all its processes, helpers included. For a project, it covers the project's processes, leaving out terminal shells. Right-click the macOS row in an app list for macOS itself.
Each thing gets one window: opening it again brings its window to the front. Windows open at 1000 × 760 points and aren't restored when Goblin restarts. Closing a window stops everything it was reading.
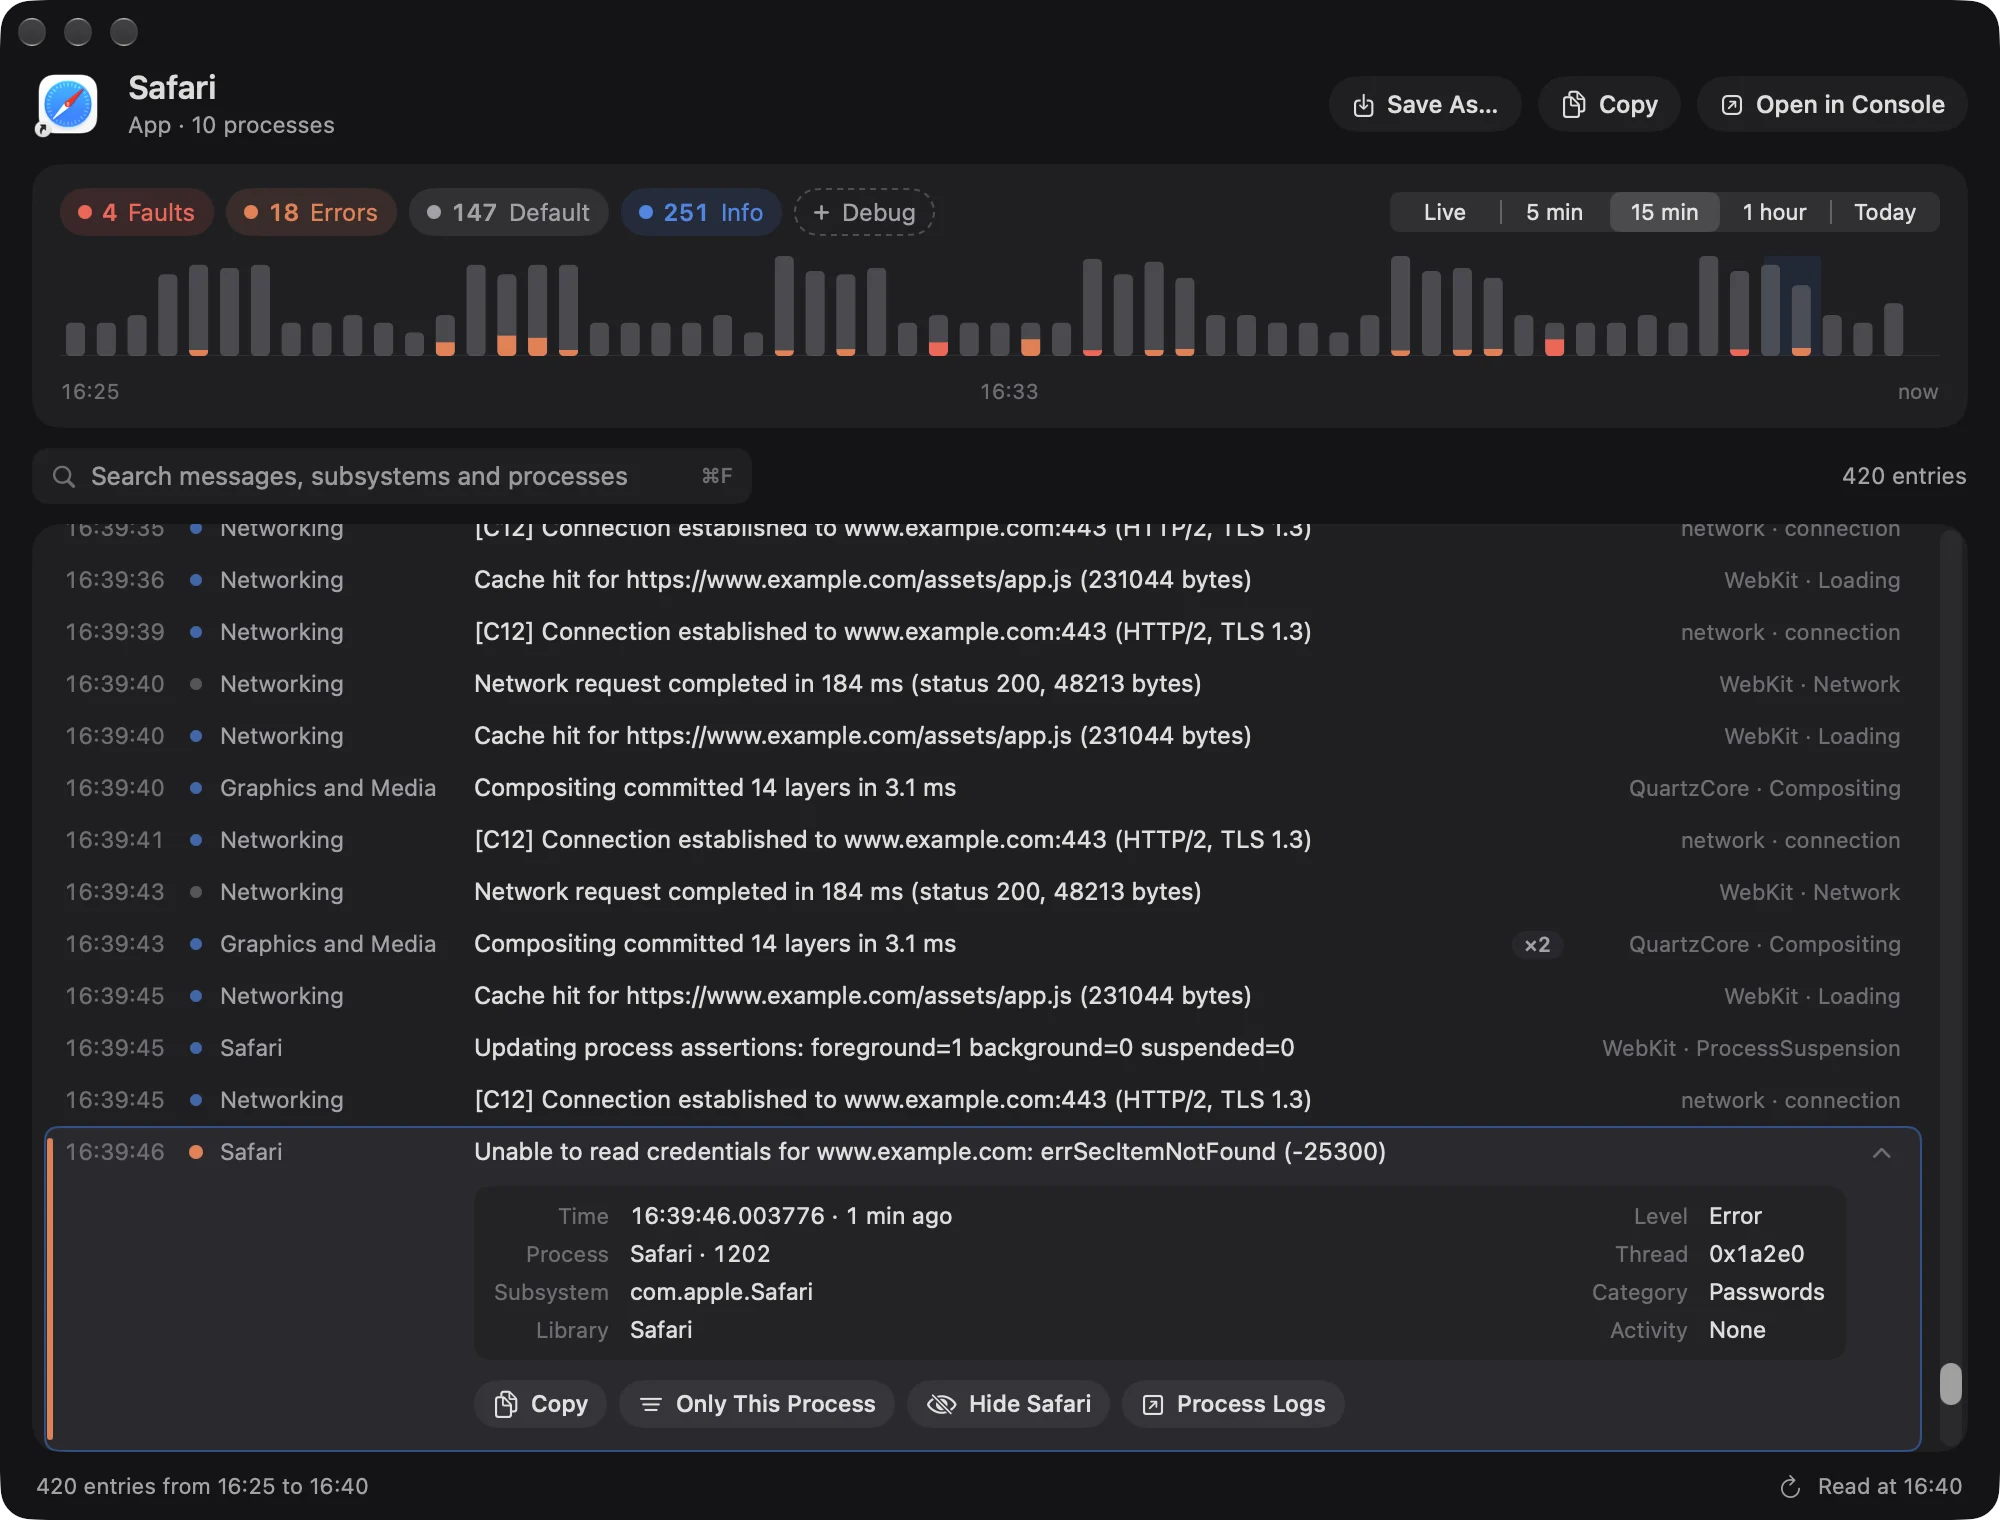
The header#
The icon and name of what you're looking at, with a line such as "App · 12 processes", "Process 4242 · Safari", "Project · 3 processes · ~/code/site" or "macOS itself · errors and faults". On the right:
| Button | What it does |
|---|---|
| Save As… (⌘S) | Saves the entries as a text or JSON file. See Saving. |
| Copy | Copies the entries shown (after filtering) as text. |
| Open in Console | Opens Apple's Console app. For a log file it opens that file; on Crashes, the newest report. For the system log it only opens Console: the tooltip tells you what to search for there, such as pid:4242, and to press Start. |
Save As… and Copy are hidden on the Crashes tab. In a narrow window the buttons show icons only.
Sources: System Log, Crashes and log files#
When there's more than the system log to read, tabs appear under the header:
- System Log: what the app sent to macOS's unified log.
- Crashes, with a count, when there are crash reports from the last 30 days.
- One tab per log file Goblin found, named after the file. Up to four fit; the rest go in a menu such as "3 more", listing each file with when it last changed. Hover a tab for the file's path, size and age.
Switching tabs clears the search, filters and selection. Coming back to the system log doesn't read it again, as long as you haven't changed the range or levels.
Where log files come from#
- Projects: text logs in the project folder itself, and in
logs/,log/,tmp/logs/,var/log/and.logs/up to two levels down. Goblin skips folders such asnode_modules,.git,vendorandvenv, and hidden files. - Apps, tools and processes: items in
~/Library/Logsnamed exactly after the app, its owner or its bundle ID. A folder with that name is searched two levels deep.
A file counts as a text log when it ends in .log, .txt, .out, .err, .trace, .jsonl or .ndjson, or has ".log" anywhere in its name. Compressed files, databases and images are left out, and so are empty files. Up to 24 files are listed, newest first. macOS itself has no log files here.
Dev servers usually print to the Terminal rather than the system log, and macOS doesn't keep Terminal output. For a project, the System Log tab says so, and links up to three of its log files when it has them.
Levels#
Show only the errors#
- Open the app's log window as above.
- Click the Errors chip at the top. The first click shows only that level.
- Click Faults as well to add the most serious entries. Click a chip again to take it off.
When it worked, the list shows only those levels and the count reads, for example, "38 of 1,240 entries". Removing the last chip shows everything again.
The level chips at the top count the entries at each level, most serious first: Faults, Errors, Default, Info and Debug.
- The first click on a chip shows only that level. Later clicks add or remove levels. Removing the last one shows them all again.
- A chip with a + and a dashed outline hasn't been read. Click it to read the log again including that level.
- Debug isn't read unless you ask: there are a great many of them, and they're mostly for developers.
- For macOS itself, only Faults and Errors are read; the other chips are hidden. To see everything a macOS process writes, open that process's own logs from an entry's menu.
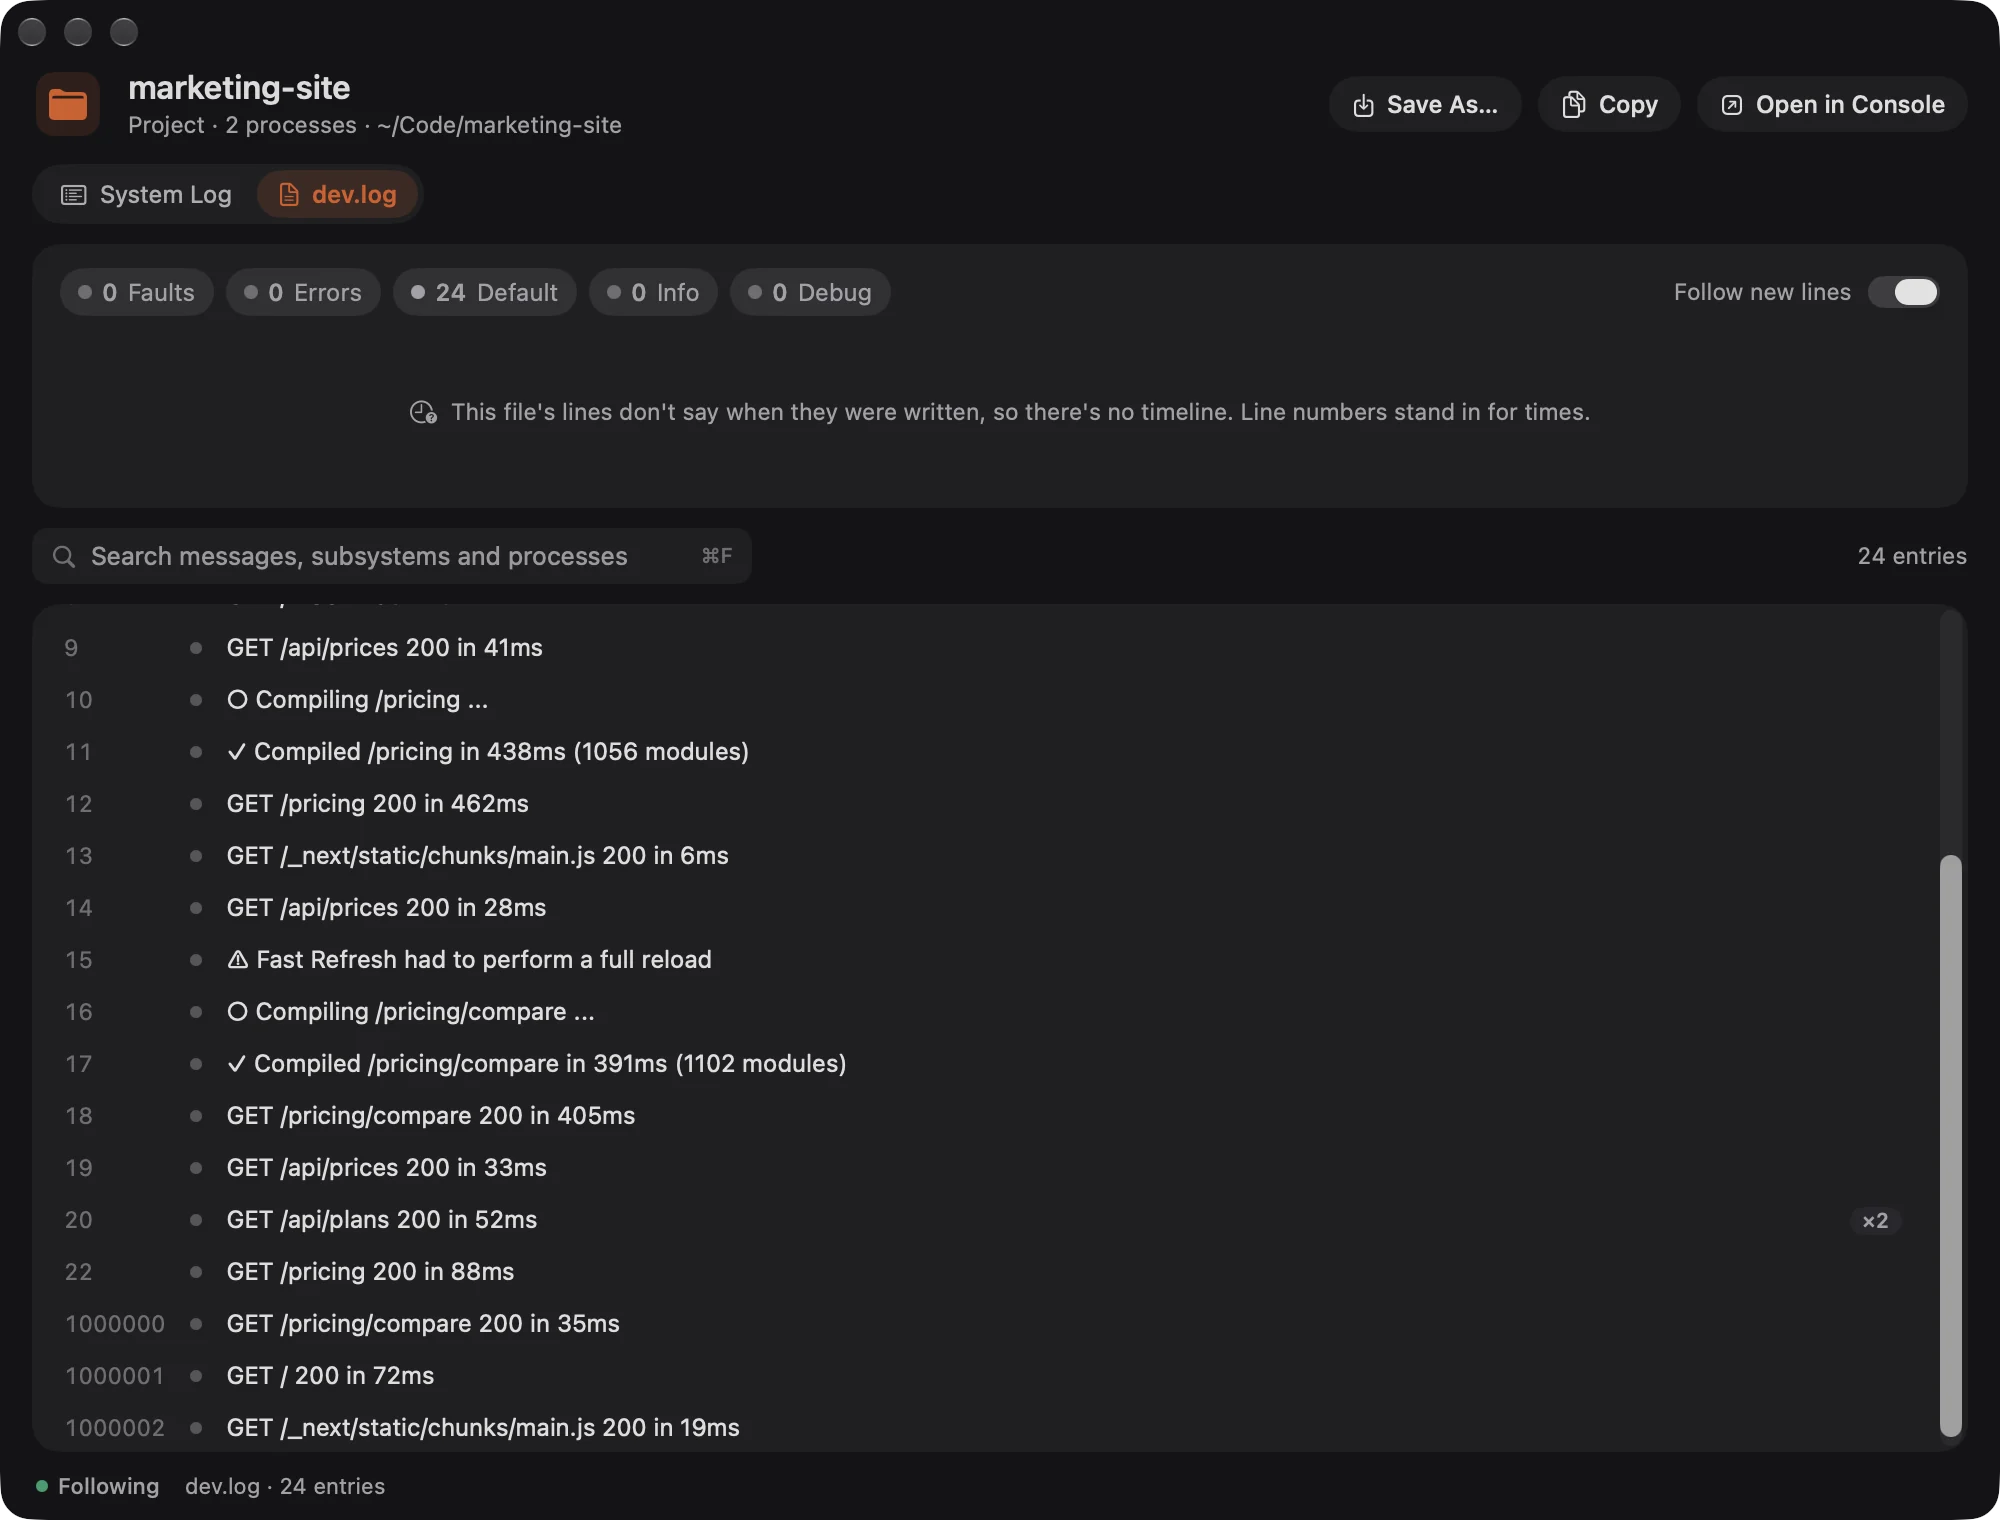
- Log files have all five levels. Goblin works out each line's level from words like "error", "warning" or "debug" near its start. There's no separate warning level: warnings count as Default.
Range and Live#
The range picker chooses how far back to read: Live, 5 min, 15 min (the default), 1 hour or Today (since midnight). For macOS, which writes a lot, it offers only Live, 5 min (the default) and 15 min.
Live reads the last 5 minutes, then adds new entries as they arrive. Pause holds the list still so you can read it; the button then reads Resume with how many new entries are waiting. Up to 8,000 can wait.
On a log file tab, Follow new lines (on by default) takes the range picker's place: new lines appear as they're written. If the file is replaced, as logs are when they rotate, the footer says so; reload to follow the new one.
The activity chart#
A bar chart under the chips shows how many entries arrived when, with faults in red and errors in orange at the foot of each bar. Bars are sized to the range, for example 15-second bars for 15 minutes or 1-minute bars for an hour.
- Hover a bar to see its time and counts.
- Click a bar to jump the list to that moment.
- While you search or filter, matching entries are drawn on top in color.
- The shaded part is what the list is showing now.
For a log file whose lines have no dates, the chart is replaced by a note, and line numbers stand in for times.
Search and filters#
The search field (⌘F) matches the message, subsystem, category and process name, ignoring case and accents. Matches are highlighted. ↓ moves into the list; Esc clears the search.
Filters show as tokens next to the search field, each with a button to remove it:
- Only \<process\>, from Show Only… or Only This Process.
- Hiding \<subsystem\>, from Hide \<subsystem\>.
The count reads "1,240 entries", or "38 of 1,240 entries" while filtering. Show All clears the search and every filter.
The list#
Each row shows the time, a colored dot for the level, the process (when more than one is involved), the message and its subsystem and category. Faults are in bold, debug messages greyed, and error and fault rows are tinted, unless most of the rows are problems anyway.
- Repeats collapse into one row with a "×N" badge when the same process logs the same message (apart from numbers) several times in a row.
- Day headings appear when the list spans more than one day.
- The list opens at the newest entry and keeps up with new ones. If you scroll up in Live, a new button with a count takes you back down.
Keys: ↑ and ↓ move the selection, Page Up and Page Down move 15 rows, Home and End go to the first and last, Space or Return opens an entry, Esc closes it, ⌘C copies the selected entry and ⌘R reads again.
Right-click an entry for Copy Entry (or Copy N Entries for a repeat), Copy Message, Show Only \<process\>, Hide \<subsystem\> and Open Logs for \<process\>.
An opened entry#
Click an entry to open it. You see the whole message, which you can select, and its facts: Time (to the microsecond), Level, Process, Thread, Subsystem, Category, Library and Activity. For a log file the facts are Time, Level, Line and File. A repeated entry lists its last 8 times.
Buttons: Copy (or Copy All), Only This Process, Hide \<subsystem\>, Process Logs, and for log files Show in Finder.
Private values#
Apps can mark parts of a message as private, and macOS then writes <private> instead, so personal data never reaches the log. Nobody can recover those parts, Goblin included. The footer shows Some values show as \<private\> when any entry has them.
Read an app's crash reports#
- Open the app's log window (right-click the app › Show Logs).
- Click the Crashes tab under the header. It only appears when the app has crash reports from the last 30 days.
- Click a row to open it. Copy Summary copies a text summary you can paste into a bug report.
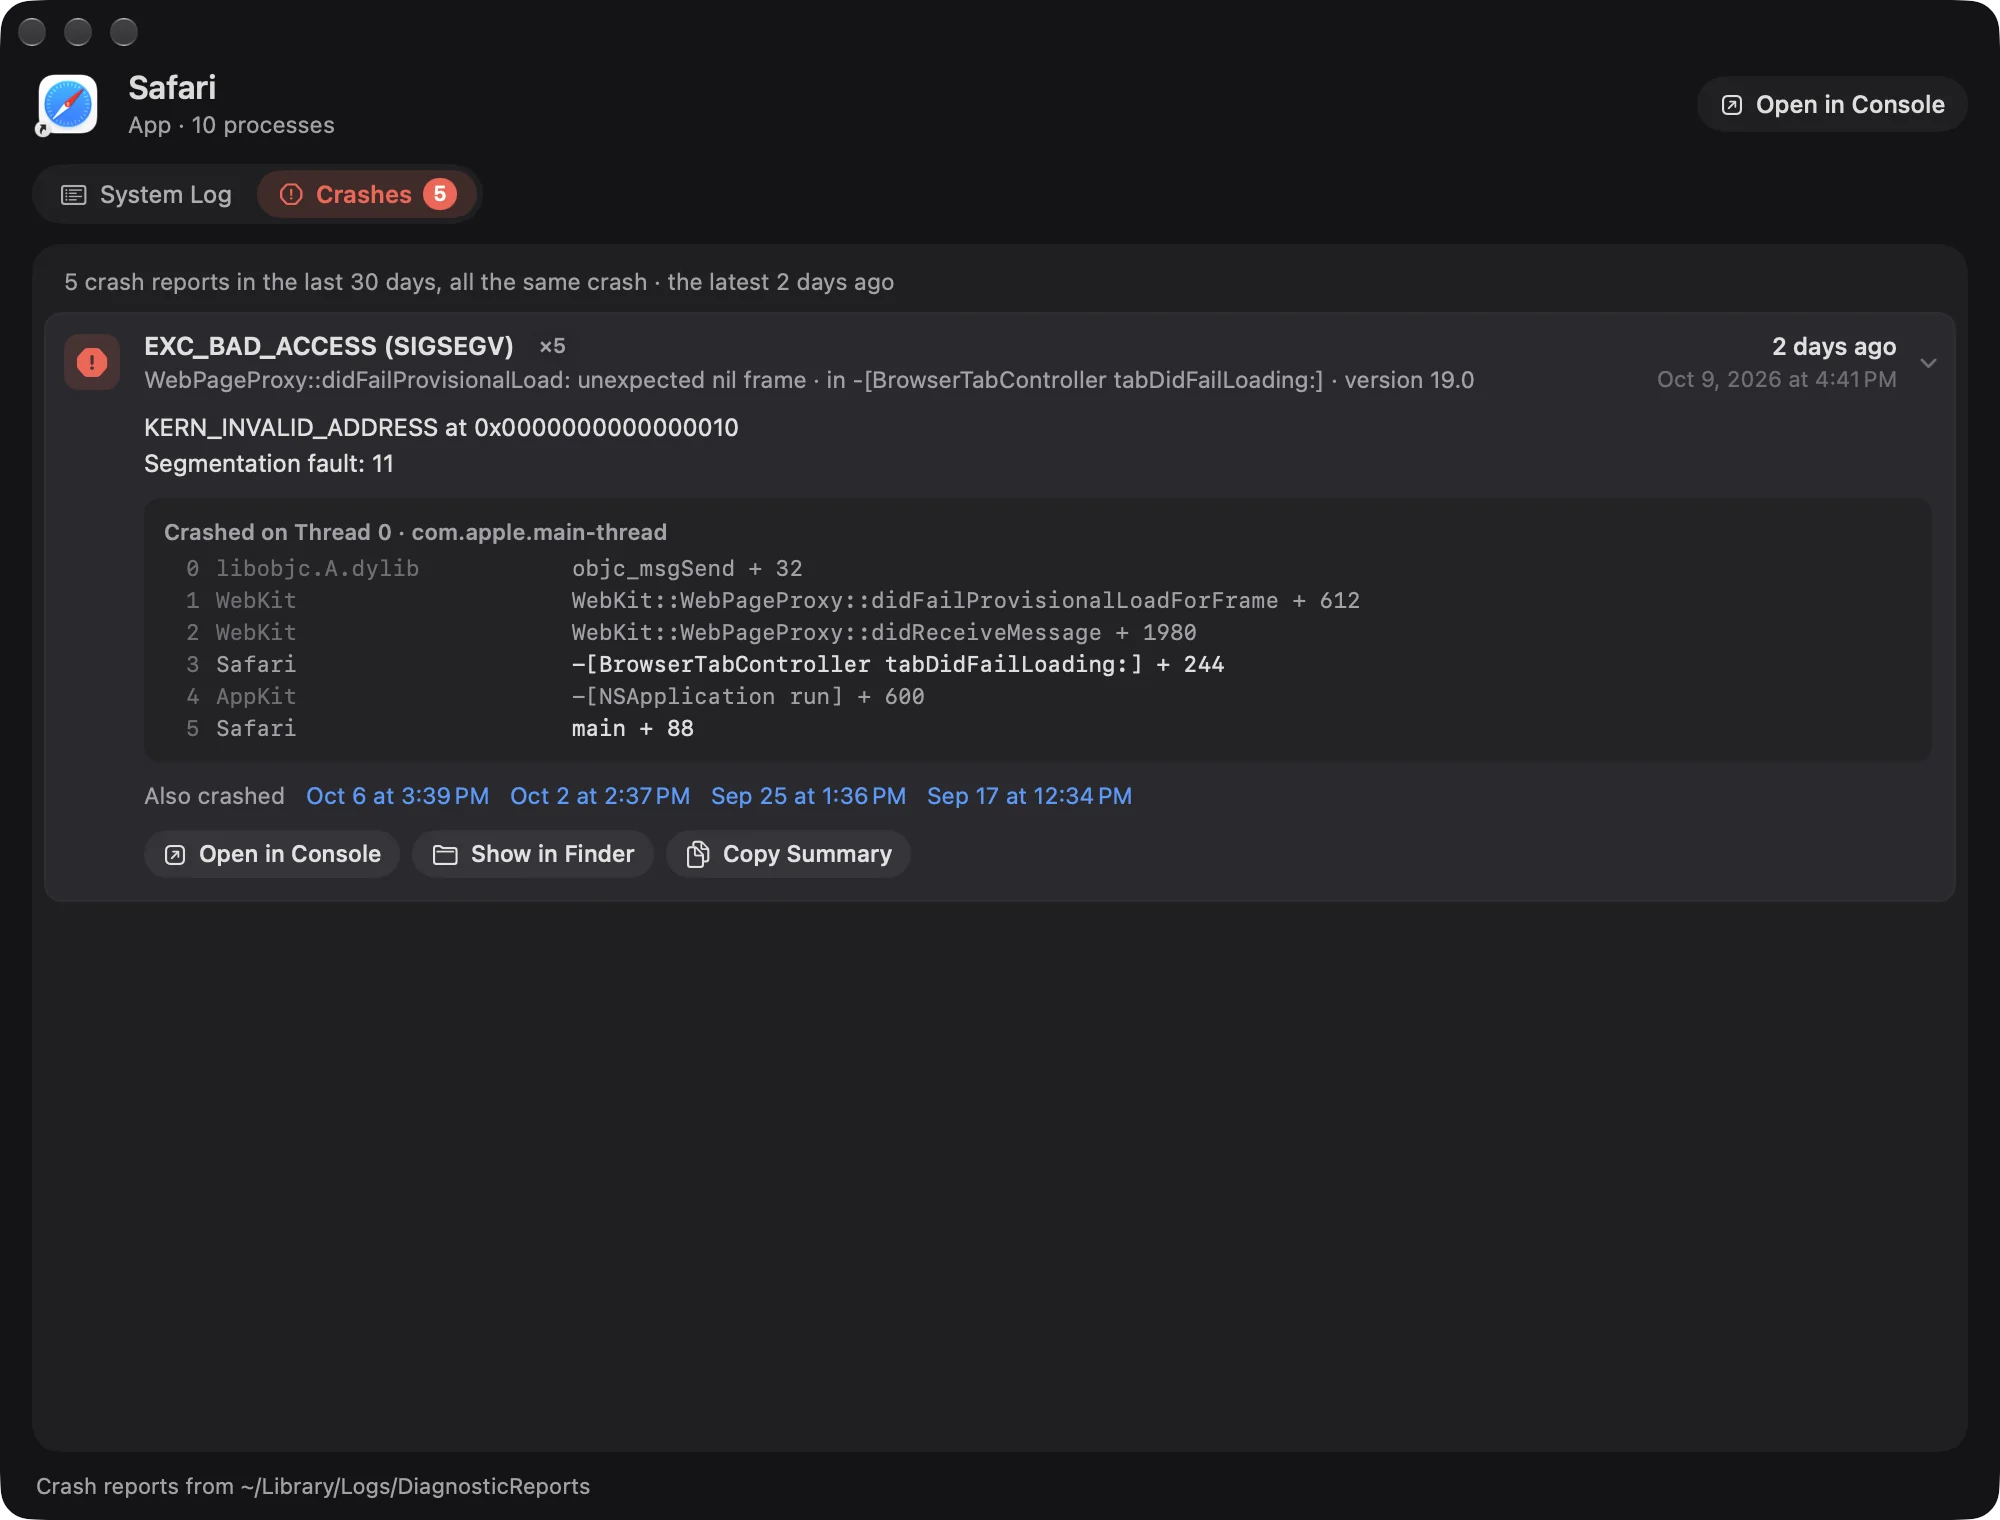
The Crashes tab lists crash reports from the last 30 days, up to 25, from ~/Library/Logs/DiagnosticReports and /Library/Logs/DiagnosticReports. A line at the top sums them up, such as "4 crash reports in the last 30 days, 2 different crashes".
Reports that crashed the same way are grouped into one row, marked "×N". Each row shows the exception (such as "EXC_BAD_ACCESS (SIGSEGV)"), the reason, the code it crashed in, the app's version, and when. Open a row for:
- up to six further reasons, from the app's last messages and the crash details;
- Crashed on Thread with the thread's name and queue, and its top 16 frames, with macOS's own code greyed;
- Also crashed: the other dates it crashed this way, each opening that report in Console;
- Open in Console, Show in Finder (selects every report in the group) and Copy Summary, which copies a text summary you can paste into a bug report.
Projects and macOS itself have no Crashes tab.
The footer#
The footer says what was read, for example "1,240 entries from 14:05 to 14:20", "Live" with a dot while streaming, or "Following" for a file. Once a read finishes, Read at 14:20 reads again (⌘R). While a long range is being read it shows the progress and a Stop button, which keeps what has been read so far.
Goblin keeps up to 8,000 entries per window, the newest ones, with room set aside so a flood of ordinary messages can't push out the errors and faults. When it had to drop older entries, the footer says "showing the latest" and how many. For log files it reads the last 2 MB and keeps the last 5,000 entries.
When there's nothing to show#
| Message | What it means |
|---|---|
| "Nothing logged in the last 15 minutes" | The app didn't write to the system log in that time. Try Last Hour or Live. For macOS, no errors in that time is good news. |
| "Nothing matches" | Your search or filters hide everything. Show All clears them. |
| "Waiting for new entries" | Live is on and nothing has arrived yet. |
| "Couldn't read the log" | See below. Try Again or Open Console. |
If there are crash reports or log files, buttons for them appear in these messages too.
Reading the system log needs an administrator account. On a standard account Goblin says "Reading the system log needs an administrator account. Sign in as an administrator, or use Console." Crash reports and log files you can open in Finder still work.
Saving#
- In the log window, click Save As… or press ⌘S. (It isn't there on the Crashes tab.)
- In the save panel, choose Plain Text or JSON, and untick Only the N entries shown if you want every entry.
- Click Save.
The save panel opens with a name like "Safari log 2026-10-02 14.20.txt".
- Format: Plain Text (the default) or JSON.
- Only the N entries shown, not all M appears when a search or filter hides some entries. It's ticked by default. Untick it to save every entry the window holds.
A text file starts with a line saying what it holds, such as "Safari — system log, 2 Oct 2026, 14:05 to 14:20, fault, error, default and info messages", followed by one line per entry in the same style as the log show command. JSON files hold the same entries with each field separately, for scripts.
Good to know#
- A window keeps the processes it found when it opened. If an app starts new helpers, or a dev server restarts, press ⌘R to pick them up. A single-process window always follows the same process.
- Copy copies what's shown, filters included. Save As… saves everything unless the checkbox is ticked.