 Goblin
Connections lists every app on your Mac that talks to the network, who it talks to, and how much data goes each way. Use it when an app seems busier than it should be, when you wonder where something phones home, or when you want to make a rule from a real connection.
Open Connections#
- Open Goblin's window and click the Network tab.
- In the sidebar, choose Connections (subtitle "Apps & destinations"). The other items are Activity (speed and quality, see Network activity) and, while the firewall is on, Rules.
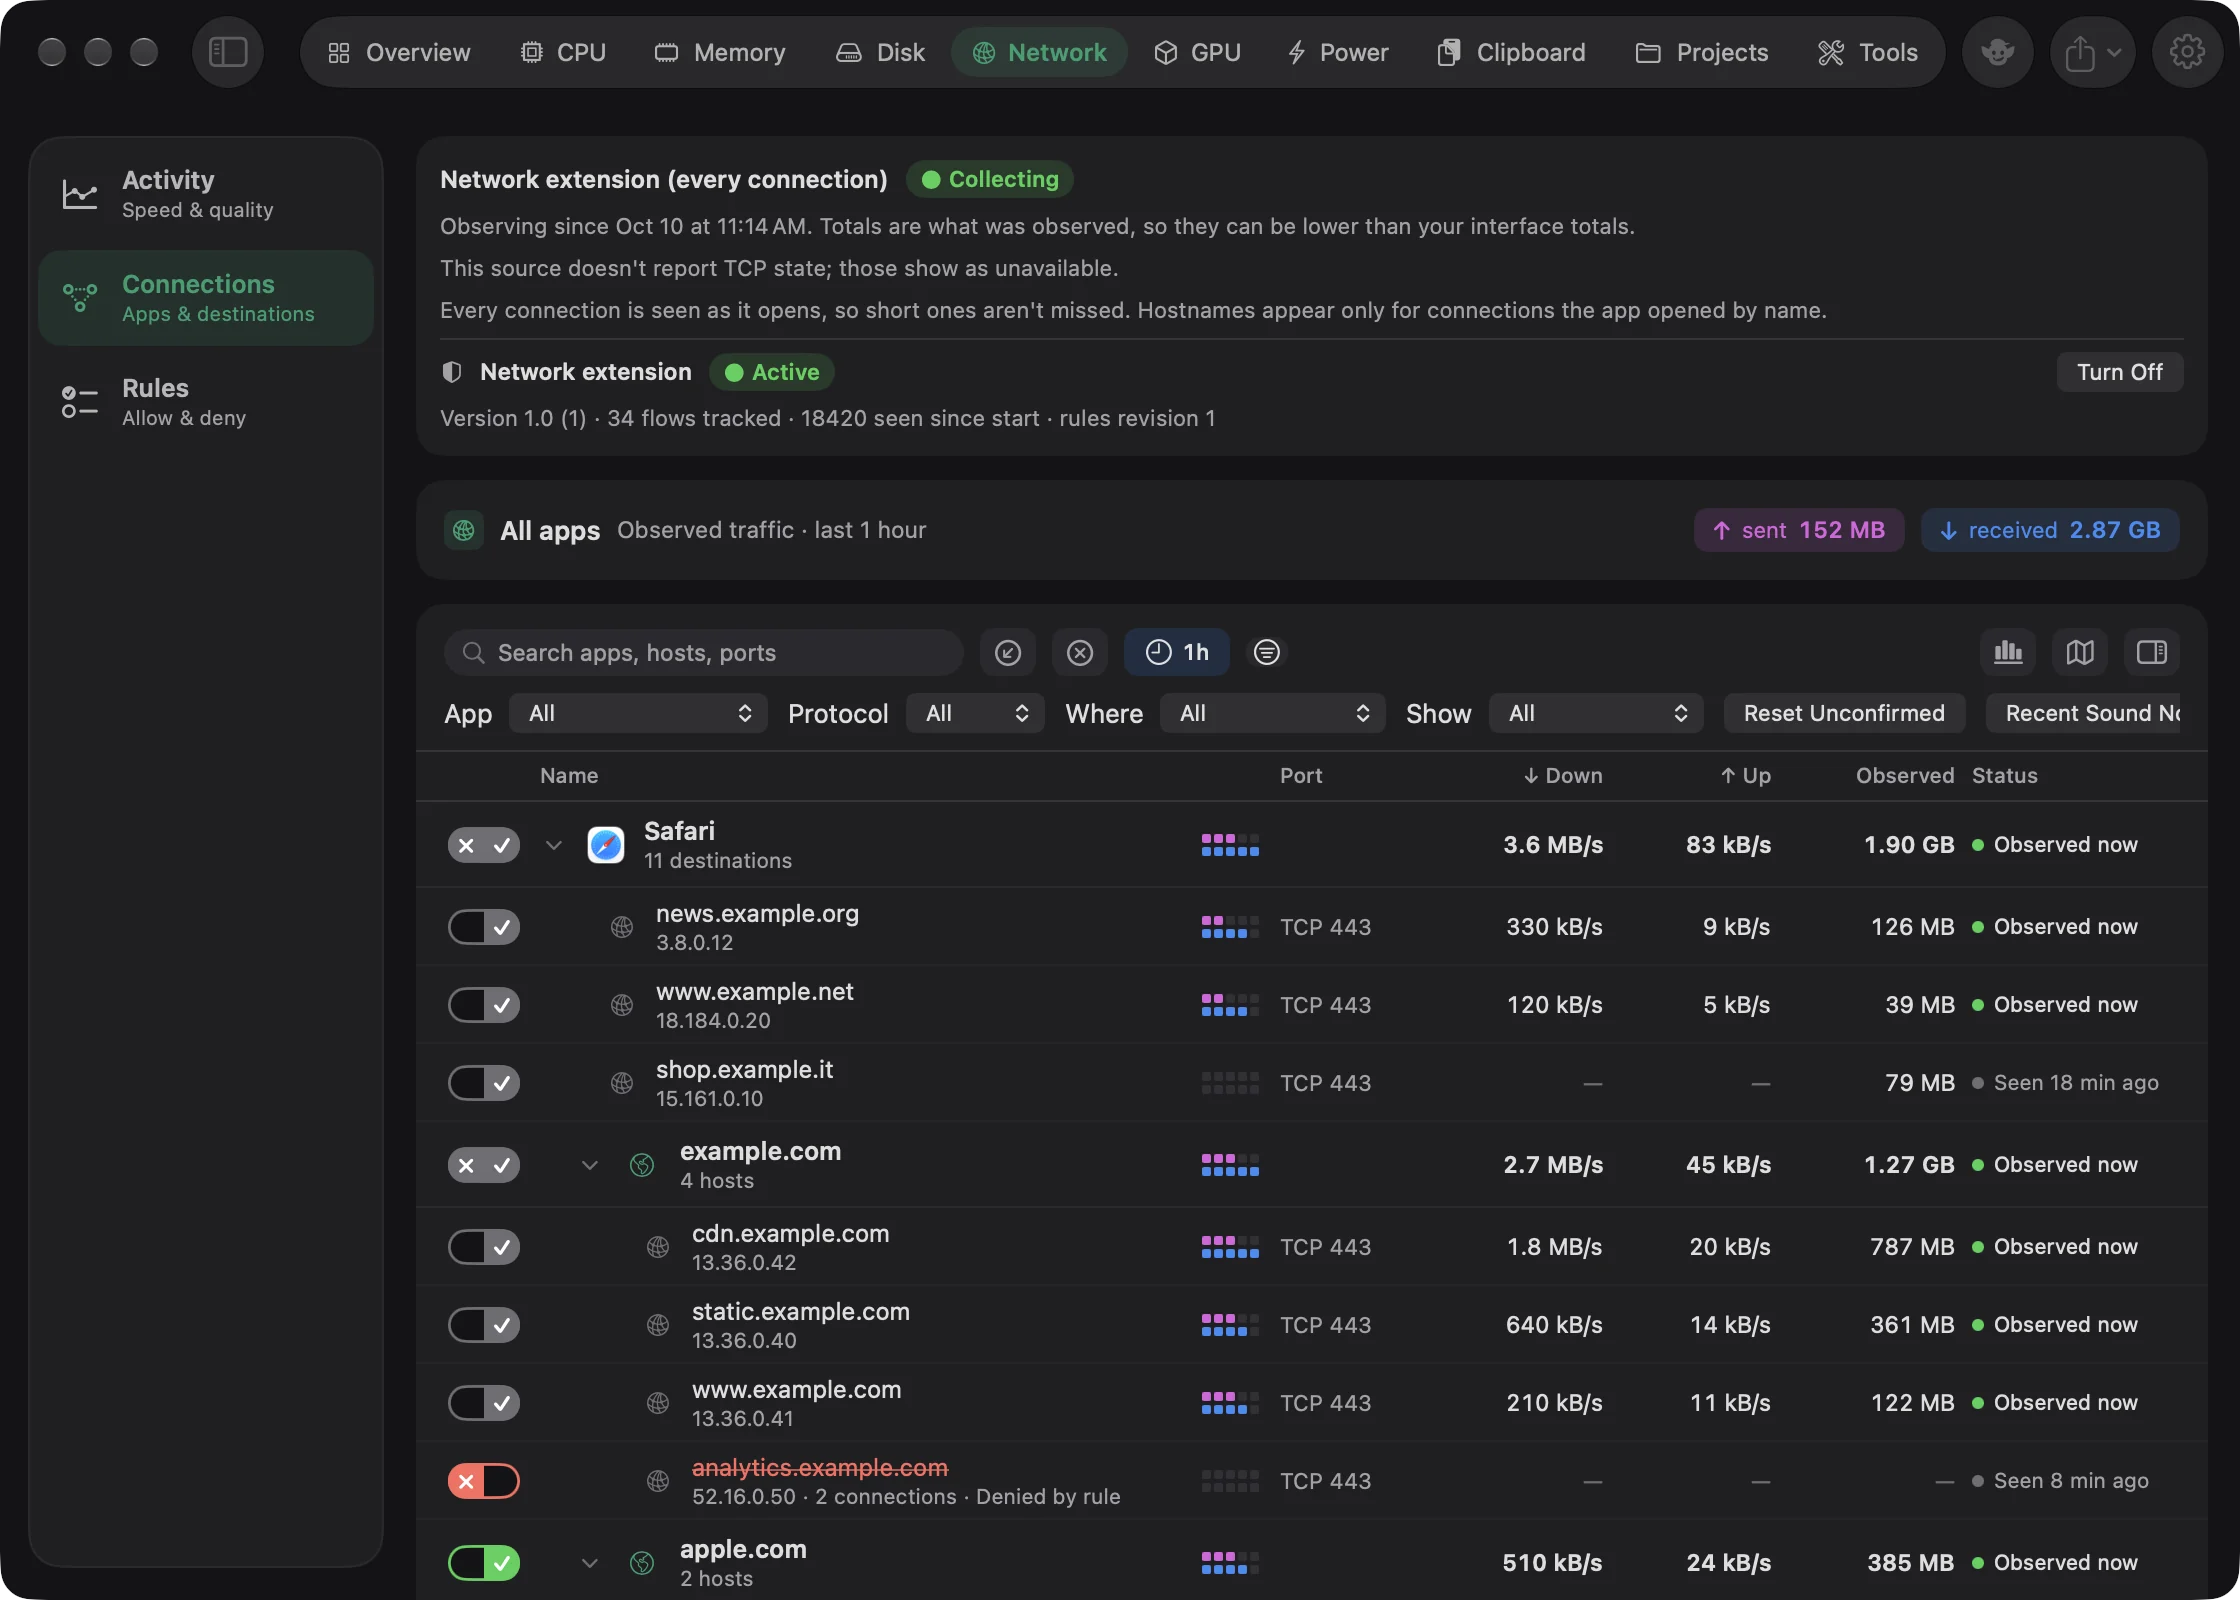
You'll see the status banner, the toolbar, the traffic chart and the grouped list of apps.
If the Network tab's sidebar has no Connections, your copy of Goblin doesn't include its network extension, and the tab only shows Activity.
Where the data comes from#
Connections works with or without Goblin's firewall. What you see depends on which one is running, and the banner at the top names the source.
With the firewall off: nettop, per connection#
Goblin asks macOS's own nettop tool what is connected, every 3 seconds. This needs no permission and installs nothing. The banner says nettop, per connection.
- Short connections can be missed. A connection that opens and closes between two samples never shows up. The banner says so: "Sampled — short connections may be missed."
- Totals are what was observed, so they can be lower than the totals for your network interface.
- No real hostnames. nettop reports addresses. Goblin adds a hint from reverse DNS or from a DNS answer it saw on this Mac, but that's a hint, not the name the app asked for.
- No history. Collection runs only while Connections is on screen, and it pauses when you leave. Nothing is kept between sessions. The banner tells you when collection resumed.
- No verdicts. Nothing is allowed or denied, so the firewall filters, switches and rule menus are missing.
- If sampling gets expensive (lots of rows or CPU), Goblin slows to every 6 seconds and then every 12, and speeds up again once things are calm. The banner tells you when it slowed.
- Listening sockets aren't listed. UDP sockets with no fixed destination show as "No fixed destination", without byte counts, and only when Where is All.
With the firewall on: the network extension#
Once the firewall is on and its extension is Active, Goblin switches to it by itself. The banner says Network extension (every connection).
- Every connection is seen as it opens, so short ones aren't missed.
- Hostnames appear for connections the app opened by name. A connection made straight to an address has no hostname.
- Each connection carries its verdict: allowed, denied, by which rule or blocklist, or waiting for your answer.
- Closed and denied connections are kept for up to 30 days, up to the Capacity in Firewall settings (20,000 by default). When it's full, the oldest closed connections go first.
- Per-app traffic is also saved to disk in 5-minute steps, whether or not Goblin's window is open. That's what the chart uses for long ranges. It's kept for 30 days by default (7 or 90 in Firewall settings).
If Goblin falls behind and the extension had to drop records, the banner says "Some connections were dropped because Goblin fell behind the extension's buffer."
The status banner#
The banner shows the source and a state chip:
| Chip | Meaning |
|---|---|
| Starting | The first sample is on its way. |
| Collecting | Data is arriving. |
| Stale · last sample Ns ago | Nothing new for more than two intervals. The list dims and shows the last sample. |
| Unavailable | The source can't run. The reason is shown with a Try Again button. |
Under it, a sentence such as "Sampled every 3 s since 10:42." (nettop) or "Observing since …" (extension), and a line naming anything the source can't supply.
The last row is about the firewall:
- Firewall off: "Firewall" with an Off chip and a Turn On… button. See The firewall.
- Firewall on: the Network extension row with its state and buttons. It's described on the firewall page.
The toolbar#
Find a connection#
- In Connections, click Search apps, hosts, ports in the toolbar.
- Type part of an app name, a hostname, an address, a port number or a service name such as
https. - Groups with a match open by themselves. Click ✕ in the box to clear it.
Filter the list#
- To show only incoming or only denied connections, click Incoming or Denied in the toolbar's first row (hover shows "Only show incoming connections" and "Only show denied connections"). Click again to turn it off. These need the firewall.
- In the second row, choose an App, a Protocol (All, TCP, UDP, Other) and a place under Where (All, Internet, Local network).
- To match one port, type its number into Port.
- With the firewall on, use Show for All, Allowed, Outgoing or Unconfirmed.
The count beside the filters, such as "12 connections current", follows what you chose. Click Clear (or Clear Filters in the filter menu) to start over.
Change the time range#
- Click the clock button in the toolbar's first row. It shows the current range, Now at first.
- Choose a range under Displayed Time Range, from Last 2 Minutes to Last 30 Days or No Time Limit.
- The button shows the short name (for example 1h) and is tinted while the range isn't Now.
Choose Open Right Now to go back to only what's open at this moment.
Group or sort the list#
- Click the filter menu (the three-lines-in-a-circle button next to the clock).
- Choose Group By and one of the six pairings, or Sort By and one of the sort orders.
First row#
- Search ("Search apps, hosts, ports") matches app names, hostnames, addresses, port numbers and service names, bundle IDs, protocols, the tool an app connected through, and blocklist entries. While you search, every group with a match opens.
- Incoming shows only incoming connections, and Denied only denied ones. Both need the firewall, since nettop has no verdicts.
- The clock button sets the Displayed Time Range (see below). It shows the short name, such as Now or 1h, and is tinted while the range isn't Now.
- The filter menu holds Group By, Sort By, the time range and the display options below.
- Traffic chart, Map and Inspector toggles show or hide those parts. The chart is on by default; the map and inspector are off. Selecting a row opens the inspector by itself. The map has its own page.
Everything you set here is remembered between launches.
Displayed Time Range#
| Choice | Button shows |
|---|---|
| Open Right Now (default) | Now |
| Last 2 Minutes | 2m |
| Last 10 Minutes | 10m |
| Last Hour | 1h |
| Last 5 Hours | 5h |
| Last 24 Hours | 24h |
| Last 3 Days | 3d |
| Last Week | 1w |
| Last 30 Days | 30d |
| No Time Limit | All |
Open Right Now lists only connections that are open at this moment, so anything already closed disappears. Any other range also lists connections last seen within it. How far back you can go depends on the source: with the firewall, up to 30 days and the Capacity; with nettop, only since you opened Connections this time.
Group By#
| Choice | Top level, then |
|---|---|
| App and Server (default) | Each app, with the servers it reached. |
| App and Country | Each app, with the countries it reached. |
| Server and App | Each server (servers sharing a domain are grouped under it), with the apps that reached it. |
| Server and Country | Each server, with the countries. |
| Country and App | Each country, with the apps. |
| Country and Server | Each country, with the servers. |
Sort By#
Network Activity (default, the current rate), Name, Traffic Volume, Traffic Volume – Sent, Traffic Volume – Received, Deny Count and Last Seen. Rows with nothing measured sort last. Ties go to the larger total, then the name.
Display options in the filter menu#
| Option | What it does | Default |
|---|---|---|
| Show Local Network | Lists connections to devices on your own network. The same setting as Where being All or Internet. | On |
| Show Connections of Other Users | Lists connections from root and other users' processes. Processes whose owner can't be read count as yours. | On |
| Show Network Extensions | Lists connections made by system extensions and network extensions. | Off |
| Float on Top | Keeps Goblin's window above other windows while Connections is showing. | Off |
| Reset Unconfirmed | Marks everything seen so far as reviewed (firewall only). | — |
| Clear Filters | Appears while a filter is active. | — |
Second row#
The second row scrolls sideways when the window is narrow.
- App: All, or one of the apps in the list. Choosing an app also focuses the chart on it.
- Protocol: All, TCP, UDP or Other.
- Where: All, Internet or Local network. Local network means private, link-local and multicast addresses and
.localnames. Sockets with no fixed destination appear only under All. - Port: type a port number (up to 5 digits) to match the remote port.
- The count, such as "12 connections current" or "… in range", and a Clear link while anything is filtered.
- Focus chips: each app, server, domain or country you focused on (see the context menu below) shows as a chip after "Focus". Click its ✕ to show everything again.
These appear only with the firewall on:
- Show: All, Allowed, Outgoing or Unconfirmed. Allowed means the verdict was allow and it isn't waiting. Unconfirmed is explained below.
- Reset Unconfirmed marks every connection seen so far as reviewed.
- Recent Sound Notifications lists only connections that made a Play Sound rule fire in the last 10 minutes.
- Bypassing Connections: see below.
The list#
Columns#
| Column | What it shows |
|---|---|
| Switch | The verdict, and a quick way to make a rule (firewall only). |
| Name | The app, server, domain or country. |
| Activity bars | 5 pink bars for sent and 5 blue for received. They light at 1 B/s, 1 kB/s, 10 kB/s, 100 kB/s and 1 MB/s. |
| Port | Protocol and port, such as "TCP 443". |
| ↓ Down | The receive rate. |
| ↑ Up | The send rate. Hidden when the window is narrow. |
| Observed | Bytes down plus up since the connection was first observed. Not lifetime totals. Hidden when the window is narrow. |
| Status | "Observed now" with a green dot, or "Seen 5 min ago". |
A "—" means the value wasn't measured. Rates use the unit you chose for network speed in General settings (bytes or bits per second). The activity bars turn grey when Activity bars is set to Monochrome in Firewall settings.
Groups#
The top level follows Group By. Under an app (App and Server) you find:
- its servers;
- bare IP addresses, collected into an IP Addresses group once there are two or more;
- servers that share a domain, under a domain group such as "apple.com" ("N hosts");
- connections a command-line tool made for the app, under via curl (or whichever tool).
Country groups show a flag, Private Relay, Local Network or Unknown Location.
Each group shows its first 5 rows and then N more…. The first time you use a grouping, the busiest group opens by itself. Click a group to select and open it, click it again to close it, or use its chevron.
Rows#
A row's subtitle adds what's worth knowing: the address, a reverse-DNS hint, "N connections", "Waiting for your answer", "Blocked by <list>: <entry>", "Denied by rule", "Denied (mode)", "Incoming" or "Unconfirmed". Denied rows are red and struck through.
Selecting#
- Click selects one row or group.
- ⌘-click adds or removes items.
- ⇧-click selects a range, and ⌘⇧-click adds a range.
With several items selected, the inspector adds them up and the context menu acts on all of them.
Empty and stale#
"No current connections" appears when nothing is open right now (with nettop: "Short connections can be missed between samples."). "No connections in this range" and "No connections match" mean the range, search or filters leave nothing; Clear Filters resets them. While the source is stale, the list is dimmed.
The row switch#
With the firewall on, each row has a small switch with ✕ on the left and ✓ on the right. Its color tells you how the connection was decided:
| Looks like | Meaning |
|---|---|
| Green ✓ | Allowed by a rule. |
| Red ✕ | Denied by a rule. |
| Blue, both marks | Decided by the operation mode, and not confirmed yet. |
| Grey ✓ or ✕ | Decided by the mode, and confirmed. |
| Grey, both marks | A mix. |
| Amber clock | Waiting for a decision. |
Make a rule from a connection#
- Find the app, server or domain in the list. Use the search box if you need to.
- To decide quickly, click ✓ on the row's switch to allow it or ✕ to deny it. A rule appears right away.
- To choose how long it lasts, right-click the row instead, then choose Allow Connections or Deny Connections and pick Permanently, Until Quit, Until Logout, Until Restart or For a While. Choose a name under In Profile “…” to put it in one profile.
- Choose Show Corresponding Rule in the same menu to see the new rule in Rules.
When it worked, the switch turns green (allowed) or red (denied), and a rule with a blue dot appears in the Network tab's Rules. This needs the firewall to be on.
Click ✓ to make an allow rule, or ✕ to make a deny rule. On a server row or group, the rule names that destination. On an app group, it covers any destination. On a domain group, it covers the domain and its subdomains. Country groups have no switch.
What a quick rule contains#
Rules made from Connections (the switch, and the Allow and Deny menus below) are built like this:
- The app is named by its signing identity when it's signed by Apple or a known developer, otherwise by its path.
- The destination is the hostname when the extension supplied one, otherwise the IP address. A domain group makes a domain rule.
- The direction matches the connection: incoming or outgoing.
- The note says "From Connections".
- It's marked unapproved (a blue dot in Rules) while "Mark new rules as unapproved" is on, which it is by default. The rule works straight away; the dot is a reminder to look at it.
Quick rules aren't offered for a country, for a selection that would make more than 25 rules, or for a row with no firewall verdict. If you've locked rule editing in Firewall settings, Goblin asks for Touch ID or your password first. More about rules: Rules and Making a rule.
The context menu#
Right-click a row or group. With several selected, the items say so, for example "for 3 Processes".
- Allow Connections › and Deny Connections › (firewall only) make a rule that lasts Permanently, Until Quit, Until Logout, Until Restart, or For a While › (10 minutes, 2 hours, 1 day, 7 days or 30 days). Below those, one In Profile “X” › submenu per profile offers the same choices for that profile. Until Quit is greyed out when Goblin doesn't know the running process.
- Reset Unconfirmed marks the selection as reviewed. On an app group, that covers the app with every destination.
- Hide Connections… asks "Also hide previous connections?":
- Hide All hides everything from it, past and future.
- Keep Previous Connections hides only connections that start from now on.
- Either way Goblin makes a Hide rule, listed under Rules›Hide with the note "Hidden from Connections". Hiding doesn't change whether connections are allowed.
- Focus on “<name>” narrows the list to that app, server, domain or country, and adds a focus chip.
- Show in Blocklist and Allow for <App> Only appear when a blocklist blocked the row. The second makes a high-priority allow rule for that app and that entry, so only this app gets through.
- Show Corresponding Rule (or Rules) opens Rules with the matching rules selected. When exactly one rule matches, an item next to it deletes that rule. When none match, the menu says No Corresponding Rule.
- Copy Name, Copy Path and Show in Finder.
- Capture Traffic… › records the app's packets For 30 Seconds, For 2 Minutes or For 5 Minutes. Goblin asks where to save a
.pcapngfile you can open in Wireshark, then asks for an administrator password, because the capture runstcpdump. Only one capture runs at a time. - Remove from List takes the rows away until they're seen again. It's temporary and makes no rule.
Hide connections#
- Right-click a row or group.
- Choose Hide Connections….
- In the dialog "Hide Connections?", click Hide All to hide everything from it, past and future, or Keep Previous Connections to hide only new ones.
The row leaves the list. A line at the bottom of the list sums up what's hidden. This needs the firewall to be on.
Show hidden connections again#
- Scroll to the bottom of the list and click the row "N connections from N apps · click to show them". Or right-click it and choose Show Hidden Connections.
- To stop hiding something for good, right-click that row and choose Manage Hidden Connections in Rules, then delete its rule under Hide.
Capture an app's traffic#
- Right-click the app's row, or select it and open the inspector's Process section.
- Choose Capture Traffic…, then For 30 Seconds, For 2 Minutes or For 5 Minutes. The item is greyed out if Goblin doesn't know the app's process.
- In the save dialog, choose where to keep the
.pcapngfile and click Save. - Enter your administrator password when macOS asks. Capturing needs it.
- While recording, the inspector reads "Capturing <App>… 24 s". Do the thing you want to record.
- When it finishes, it reads "Saved <file name>". Click Show to reveal the file in Finder, then open it in Wireshark.
Only one capture runs at a time.
Hidden connections#
Hidden connections are summed up in a row at the bottom of the list: "N connections from N apps · click to show them". Click it to list them. Right-click it for Show Hidden Connections or Manage Hidden Connections in Rules. To stop hiding something, delete its Hide rule in Rules.
Unconfirmed connections#
Review unconfirmed connections#
- Set Show to Unconfirmed in the toolbar's second row. These are the blue ones: only the operation mode decided them.
- For each app you recognize, make a rule (see Make a rule from a connection).
- When you've looked, click Reset Unconfirmed in the toolbar, or right-click one app and choose Reset Unconfirmed.
With the firewall on, a connection is unconfirmed (blue) when no rule or blocklist decided it, only the operation mode did, and you haven't answered an alert for it. That's the case for everything in Silent Allow and Silent Deny that no rule covers. Unconfirmed connections are the ones worth a look: either make a rule for them, or mark them reviewed with Reset Unconfirmed. After a reset, only connections that appear later count as unconfirmed. The first time Goblin runs, everything already seen counts as reviewed.
Bypassing connections#
With the firewall on, the Bypassing Connections toggle runs nettop alongside the extension and lists connections that nettop saw but the firewall didn't. Those rows say "Bypassed the firewall". If none turn up, you see "No bypassing connections".
It compares by protocol, address and port, not by app. It can't judge connections that were already open when you turned it on, connections too short for a sample, anything younger than 6 seconds, loopback traffic, or sockets with no fixed destination.
The traffic chart#
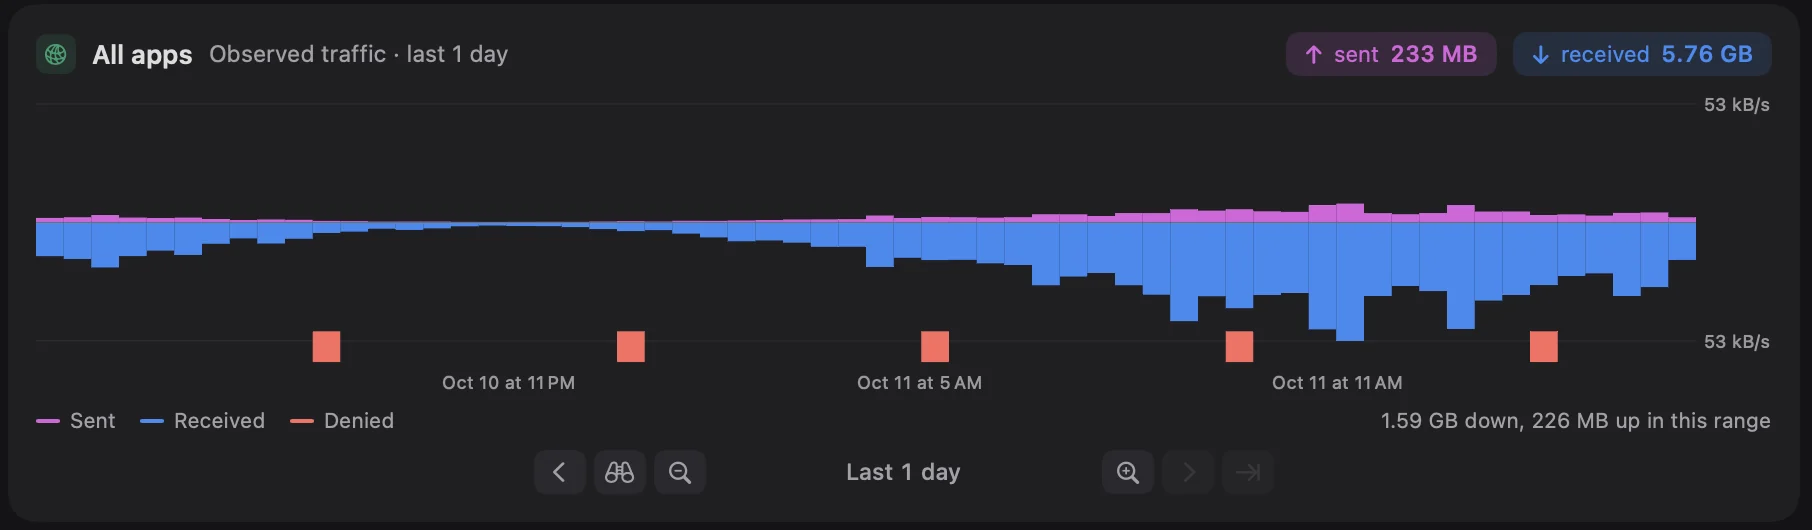
The chart card sits above the list. To show or hide it, click the Traffic chart button in the toolbar.
- Header: the focused app's icon and name with an All apps link, or "All apps". Then "Observed traffic", with the span when one is set, and two tiles: ↑ sent and ↓ received. The tiles add up everything the list currently shows.
- Bars: 60 bars across the span, sent above the line in pink, received below in blue. A thin red Denied band appears underneath when connections were denied.
- Coverage: with nettop, "Since Goblin started observing at 10:42. Earlier traffic isn't stored." With the firewall, ranges of 5 hours or longer, and any span in the past, come from the saved history ("… recorded since <date>"). Shorter ranges use what this session saw.
Traffic to your own network counts unless Include local network traffic is off in Firewall settings.
The timeline#
The buttons under the chart move through time:
| Button | What it does |
|---|---|
| ‹ | Moves back half a span. |
| Binoculars | Zoom to fit: shows all stored traffic. |
| − | Zooms out: doubles the span, up to 90 days. |
| + | Zooms in: halves the span, down to 1 minute. |
| › | Moves forward half a span. When it reaches now, it follows the present again. |
| ⇥ | Jumps to now. |
The label between them reads like "Last 1 hour, 16 minutes", or "…, ending 3:42 PM" for a span in the past.
These buttons filter the list too: it shows connections that were open at any point in the span. The span replaces the Displayed Time Range until you pick a range again.
The inspector#
Open the inspector#
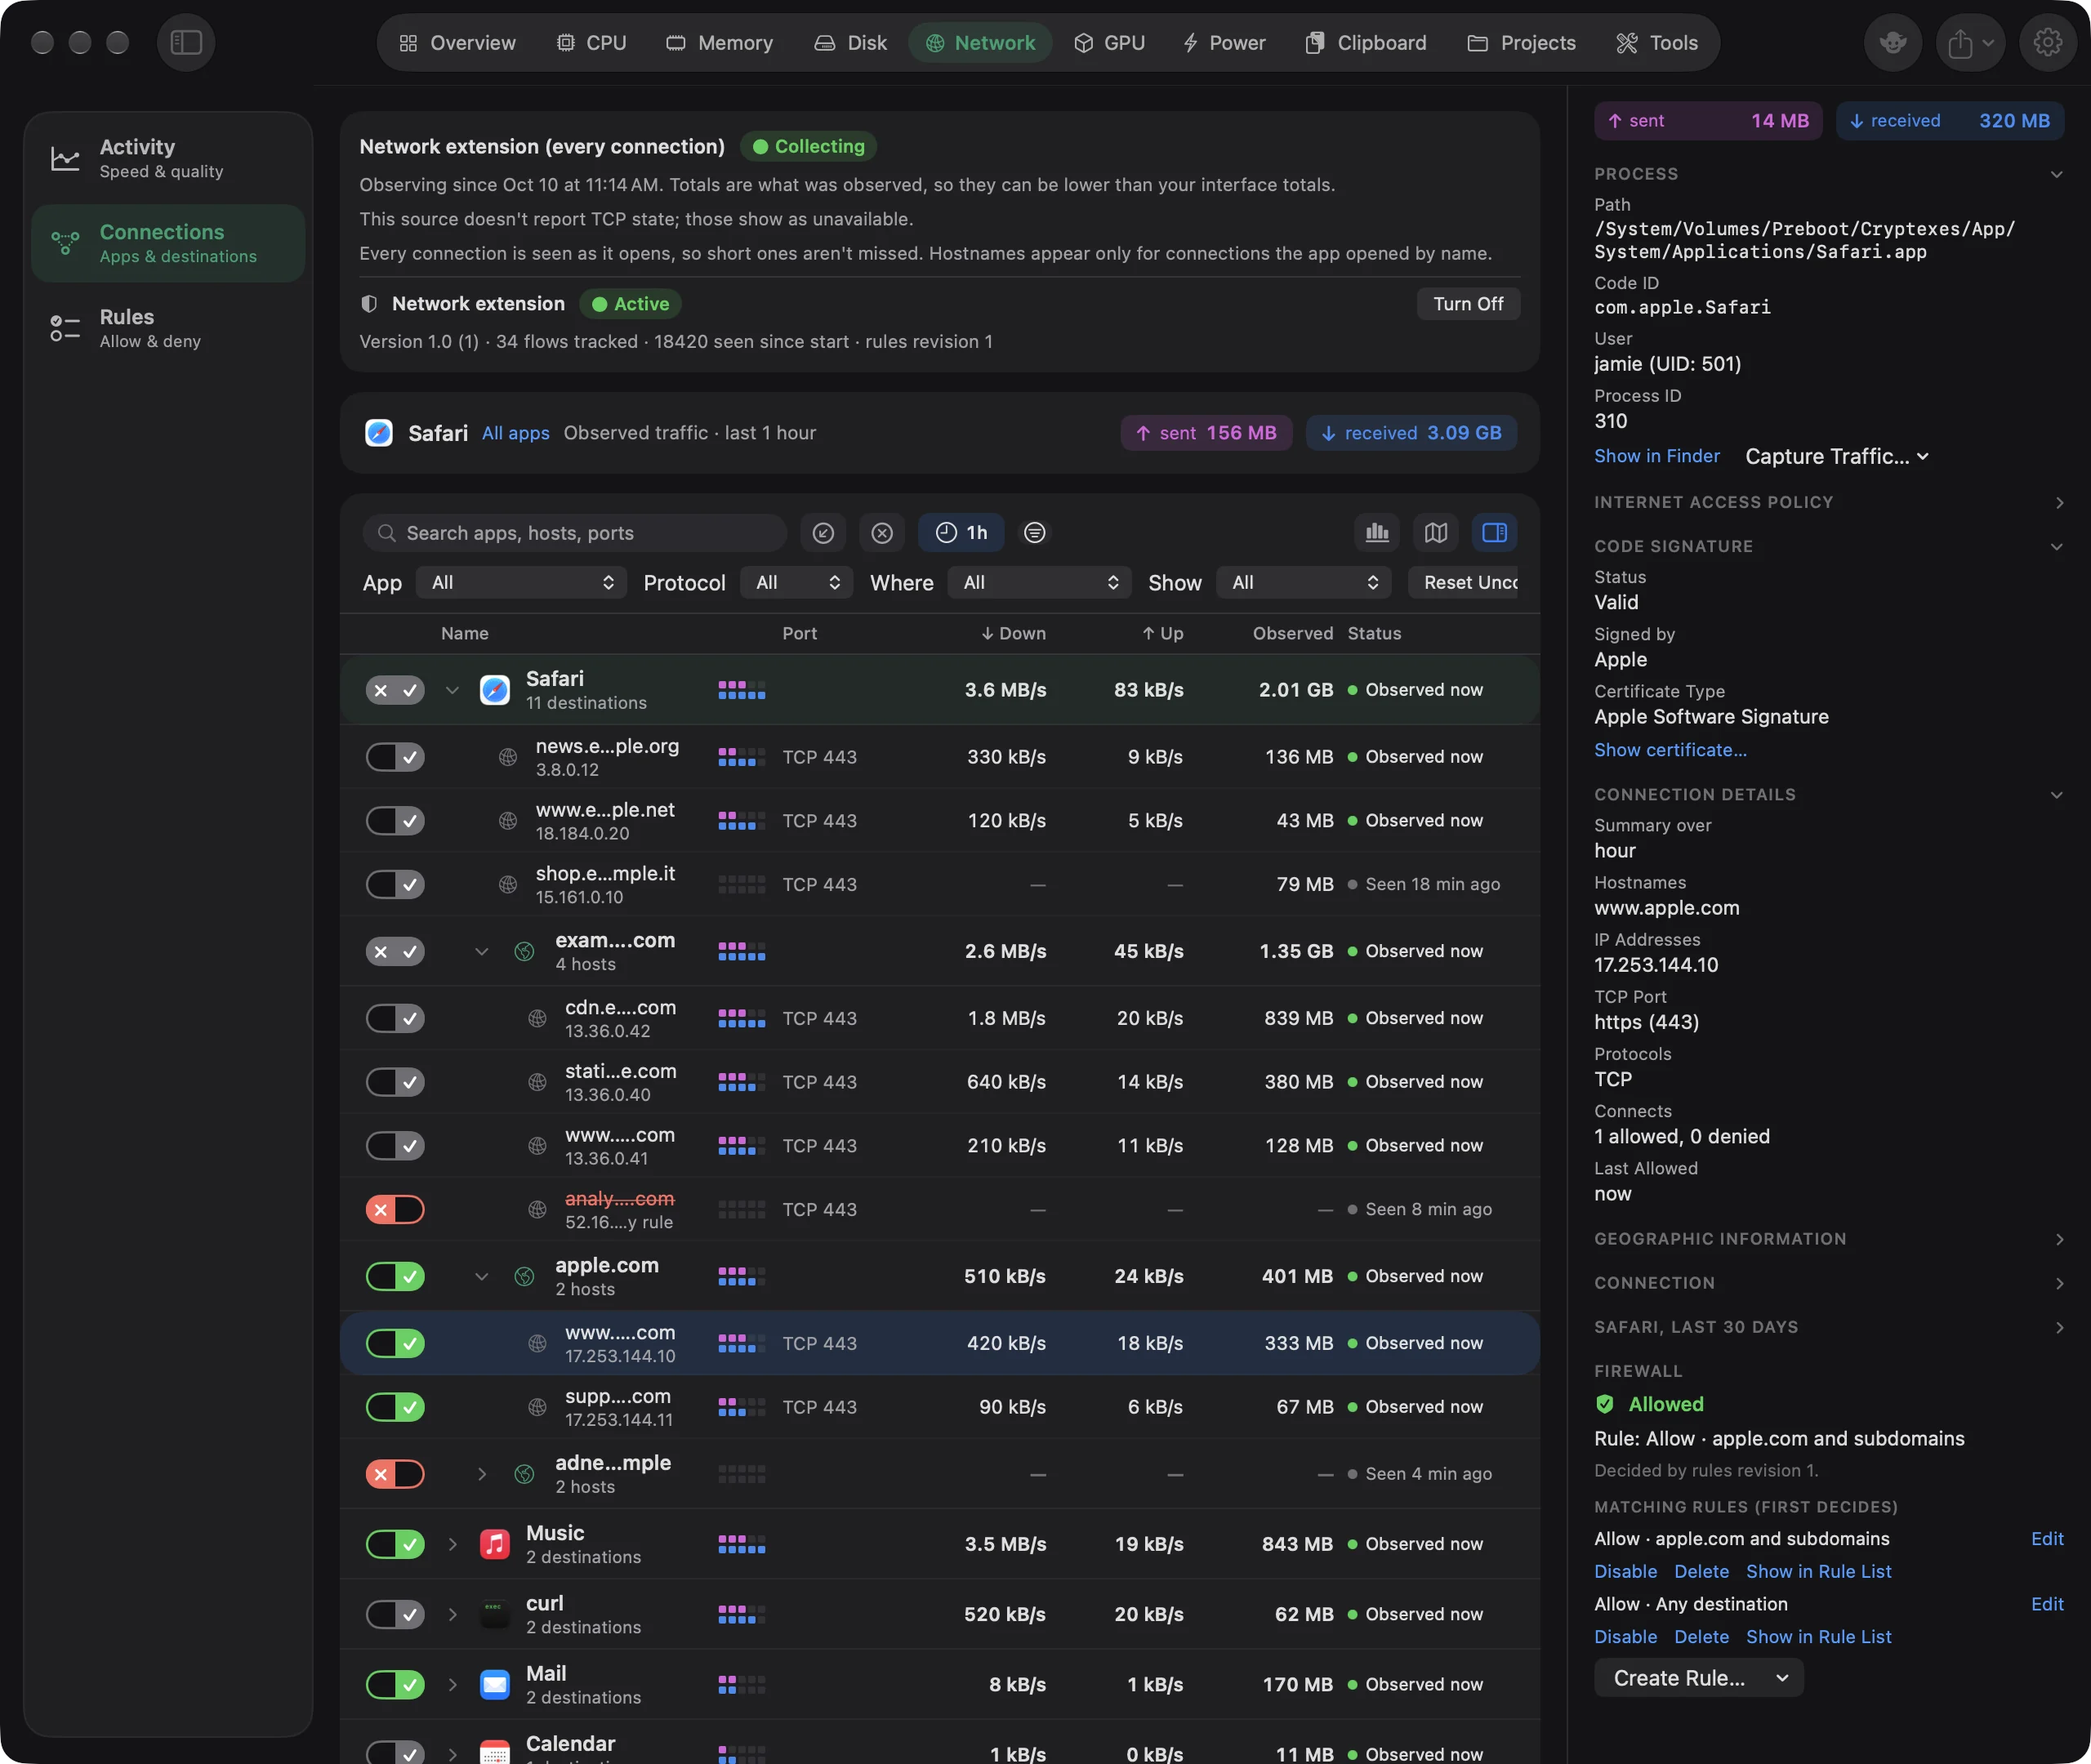
- Click a row in the list. The inspector opens beside the list by itself.
- Or click the Inspector button at the right end of the toolbar's first row to open it with nothing selected.
- To close it, click the ⓧ at its top right, or click Inspector again.
See why a connection was allowed or denied#
- With the firewall on, click the connection's row.
- In the inspector, scroll to Firewall. It states the verdict ("Denied", "Allowed", "Waiting for your answer in a connection alert") and why.
- Under Matching Rules (first decides), use Edit, Disable or Enable, Delete and Show in Rule List on the rule that decided it.
- To make a rule from here, open Create Rule… and choose one of the suggestions.
With nothing selected, it shows a Summary: how many processes and domains, the sent and received tiles, counts of denied, unconfirmed and incoming connections, and the top 5 processes, domains and countries.
With a selection, it shows the parts that apply. Click a part's title to fold it; Goblin remembers which ones you folded.
| Part | What's in it |
|---|---|
| Totals | Sent and received. If the item has left the list (filters, range, or not seen again), a note says its last details are shown. |
| Blocklist | Which list blocked it, the entry, and what the entry matches, with Show in Blocklist and Allow for X Only. |
| Process | Path, Code ID, user, process IDs, the tool it went through, when it started. Show in Finder and Capture Traffic…. |
| Internet Access Policy | What the developer says the app connects to and why, and what happens if you deny it, with a link to the developer's website. Or "This application has no Internet Access Policy". |
| Code Signature | Valid, ad-hoc, not signed or invalid; who signed it; the certificate type; Show certificate…. |
| Connection Details | Hostnames and addresses, ports with service names, protocols, how many connections were allowed and denied, and the last of each. |
| Geographic Information | The country, or up to 6 places with their counts. |
| Connection | For one row: local and remote endpoints, the hostname and where it came from, protocol, TCP state, first and last observed, bytes and rate, and up to 12 individual connections. |
| <App>, last 30 days | Down, up and denied from the saved history, with Reset <App>'s Counters. That link clears the app's saved history at once, without asking. |
| Firewall | See below. |
"Hostname from" tells you how much to trust a name: "Provided by the system for this flow" is what the app asked for; "Reverse DNS (a hint, not what the app asked for)" may differ.
The Firewall part#
With the firewall on, a single row shows its verdict ("Denied", "Allowed", "Waiting for your answer in a connection alert") and why: the rule or blocklist, "No rule matched; the mode decided.", or what happened with an alert. Under Matching Rules (first decides) you see up to 6 rules, each with Edit, Disable or Enable, Delete and Show in Rule List. The Create Rule… menu offers "Deny <App>…", "Allow <App>…", "Deny <App> to <destination>…" and "Allow <App> to <destination>…", each opening the rule editor already filled in.
A group shows up to 8 rules that decided its connections, with Show All in Rule List, or "No rule decided these connections; the operation mode did."
If the extension isn't active, a note says rules aren't enforced right now: a new rule is saved but won't affect connections yet.
Other ways in#
- A global shortcut can open Connections from any app. It's off by default; turn it on under Status Menu in Firewall settings.
- Show Network Monitor in a connection alert opens Connections focused on that app, with the other filters cleared.
- Show in Connections on a rule in Rules searches Connections for that rule's app.
Local tasks list exact monitor options and set advanced JSON filters using native enum values and current app/country IDs. Review Mark Network Connections Reviewed, Review Remove Network Connection Rows, Review Hide Network Connections and Review Allow Blocked Network Connections resolve exact current row IDs and prepare native confirmation. Counter resets require an exact app ID. Certificate viewing opens the native viewer. Traffic capture requires appID and 30, 120 or 300 seconds, then native destination and administrator prompts. Read Network Traffic Capture Status reports native progress; cancellation dismisses pending review/picker, while a confirmed duration-bound capture continues.