 Goblin
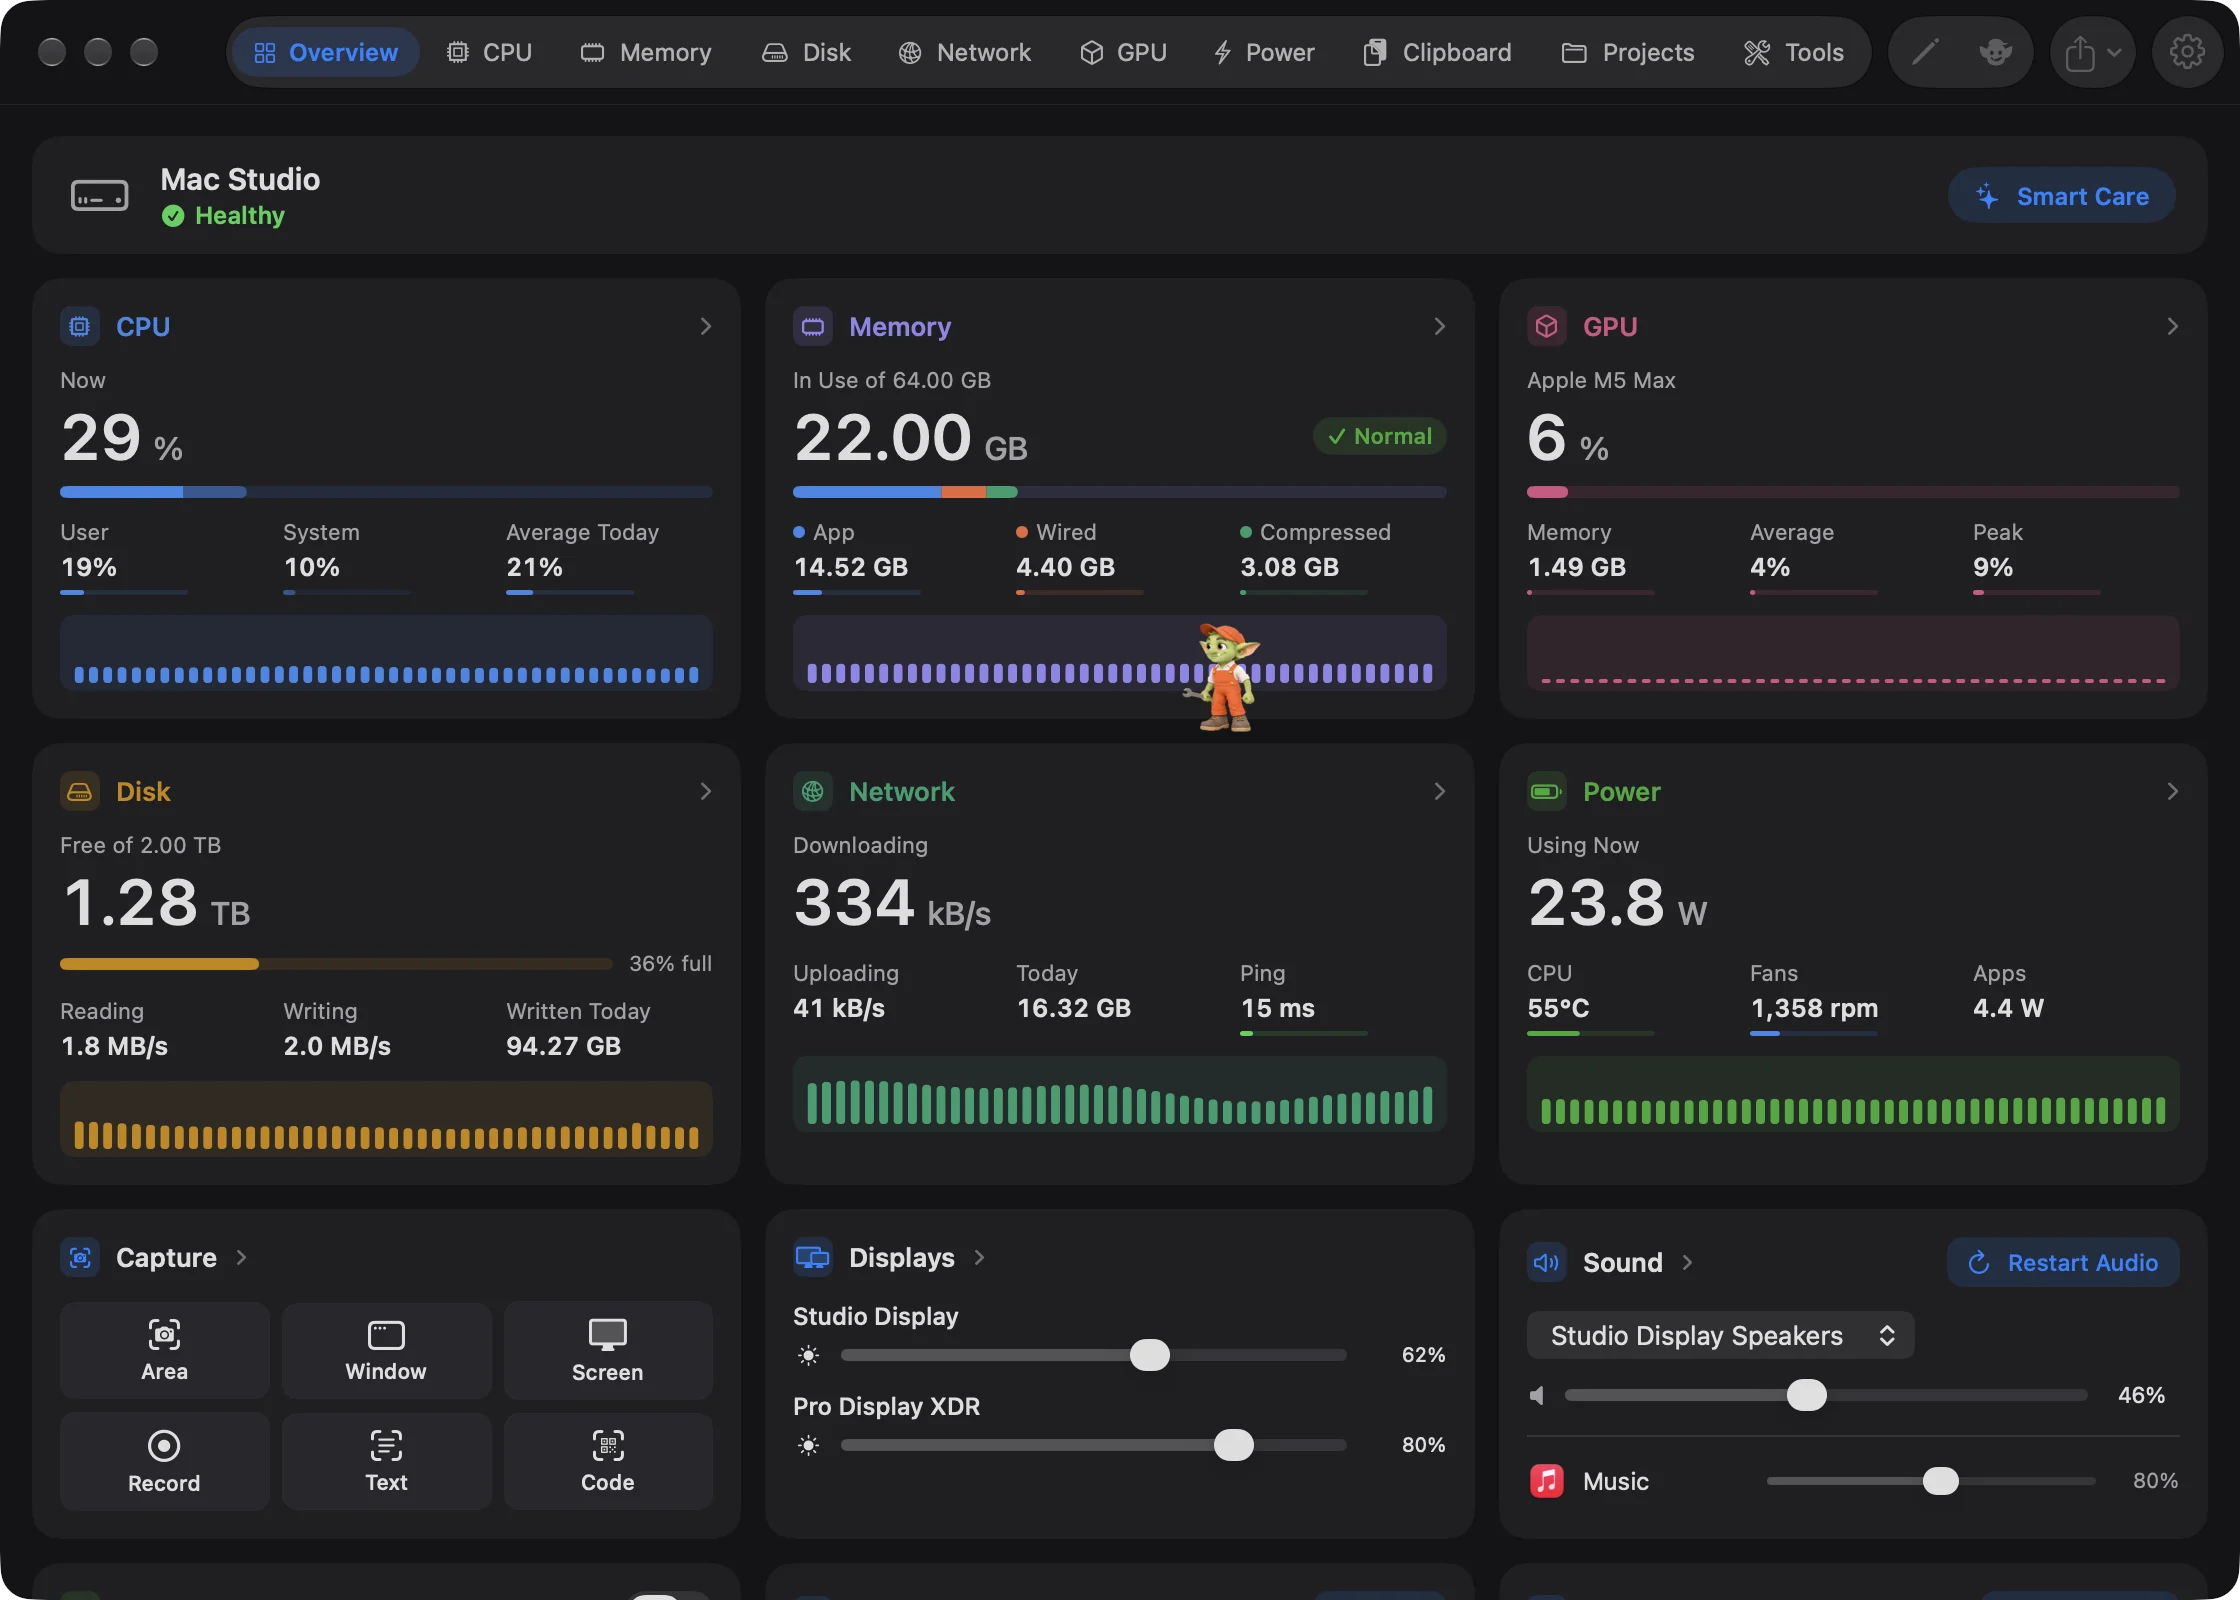
's main window is where you look closer. The Overview tab gathers the figures that matter most on one screen: a card for each part of the Mac, the alerts worth knowing about, and a banner that names any problem along with a button to fix it. Every other tab goes deeper into one subject. Use this page to find your way around the window, fix a problem the banner points out, or choose which cards the Overview shows. It covers the window itself and every card on the Overview.
The window#
The window opens on Overview each time Goblin starts. It can be made as small as 600 × 420 points. Below 880 points wide, the tab bar becomes a menu called Choose a page, and the toolbar buttons fold into a More actions menu.
Switch between tabs#
- Click a tab in the tab bar in the middle of the toolbar, or
- press its shortcut (⌘1 to ⌘0, in the order of the bar), or choose it from the View menu.
In a narrow window the tabs show only their icons, or one Choose a page menu; rest the pointer on an icon to see its name and shortcut. The tabs, in their default order:
| Tab | Shortcut | What's there |
|---|---|---|
| Overview | ⌘1 | This page. |
| CPU | ⌘2 | The processor and the apps using it. |
| Memory | ⌘3 | Memory, memory pressure and swap. |
| Disk | ⌘4 | Storage, cleanup and uninstalling. |
| Network | ⌘5 | Speed and connection quality, plus connections. |
| GPU | ⌘6 | The graphics processor. |
| Power | ⌘7 | Three pages: Battery, Temperatures & Fans and Keep Awake. |
| Clipboard | ⌘8 | Your clipboard history and pinboards. |
| Projects | ⌘9 | Coding projects and dev servers, and Docker containers as a second page when Docker is installed. |
| Tools | ⌘0 | Capture, Displays, Sound, Fix-its and the rest of Goblin's one-click tools. |
New: Coming in the next update. Ten tabs instead of thirteen. Battery and Thermals became the Power tab, Containers became a page of Projects, and Sound and Displays moved into Tools. Anywhere that remembered an old tab (a notification, a shortcut, a saved choice) opens the page that took its place.
Containers (a page inside Projects) appears only when the docker command is installed in one of the usual places (/usr/local/bin, /opt/homebrew/bin, inside Docker.app, or ~/.docker/bin). Docker doesn't need to be running. Every tab is available on every Mac, including Power on a Mac without a battery (its first page is then called Power too and shows watts), and Clipboard while Clipboard is off (it then offers to turn it on). Power and Projects each have a switcher at the top for their pages, and the Tools tab has a sidebar.
The View menu lists the same tabs with the same shortcuts. A tab you've left out of the bar stays in the View menu, without a number.
Choose which tabs show, and their order#
- Open Settings (⌘,) and click Layout.
- At the top, next to Layout for, click Main Window.
- In the Tab Bar card, click a tab to show or hide it, and drag a tab to move it. Overview can move but not hide.
- Click Reset to Default to put them back.
The bar above the tiles previews the result. The menu bar panel's tabs and the ⌘1 to ⌘0 shortcuts follow the same order. More in Layout settings.
Toolbar buttons#
- Hide Sidebar / Show Sidebar, at the left, appears on the Disk and Tools tabs and on Network when it has a sidebar, in a window at least 880 points wide. The tabs share the setting, so hiding one sidebar hides them all.
- Edit Layout (the pencil) appears on the Overview and on Tools (on All Tools). Click it to arrange the cards, then click Done. See Choose your cards.
- The Goblin's face, at the right, opens a conversation with him (⇧⌘G); its tooltip reads Talk to and his name. See Meet the Goblin.
- Share or export (the square with an arrow) saves or copies a picture of your Mac's state, a text summary, or a spreadsheet of every app and process. See Export and share.
- Settings (the gear) opens the Settings window.
Other things the window does#
- Short messages slide up from the bottom and vanish after a few seconds, such as "Safari quit. 1.2 GB is free." or "Path copied".
- App details open on the right side of the window when you double-click an app or click its ⓘ button. The tab you were on stays on the left. See App Inspector.
- On the Clipboard tab, while Clipboard's presentation mode is on, the window is left out of screenshots and screen sharing. See Clipboard privacy.
- The Goblin walks across the Overview cards. See Meet the Goblin.
- Clicking a Goblin notification opens the window on the tab the notification is about.
- Goblin stops drawing figures in the window while it's minimised, on another Space or fully covered, which keeps it light. See Performance.
New in 1.1: Color themes from Settings›Appearance›Colors re-color the window, the tab bar and the cards. See Appearance.
The Overview, top to bottom#
- The Mac health line: your Mac's name and a one-word verdict, with a Smart Care button.
- The status banner, only while something needs a look.
- The cards, three to a row (two while app details are open on the right).
The Mac health line#
New in 1.1: A line at the top of the Overview names your Mac (for example "MacBook Pro") and gives a verdict: Healthy, Worth a look or Needs attention.
The Smart Care button next to it opens Disk›Smart Care, and starts a scan straight away if the verdict isn't Healthy or Smart Care has never run. How the verdict is reached, and how to hide the line, is on Health and alerts.
The status banner#
The banner is how you find out what's wrong and fix it without hunting through tabs. When the health check finds a problem, a colored banner appears above the cards. Amber means worth a look; red means it needs attention. It shows the most pressing problem: a short title, a sentence that explains it, and one or two buttons. If there's more than one problem, a +2 more link (or however many there are) opens the rest, each with its own buttons. Show less folds them away again.
To fix a problem:
- Open the Overview (⌘1) and read the banner's title and the sentence under it.
- Click the button that names the fix (see the table below). Click +2 more (or however many) first to see the other problems.
- If Goblin asks first, read the question and confirm, or click Cancel.
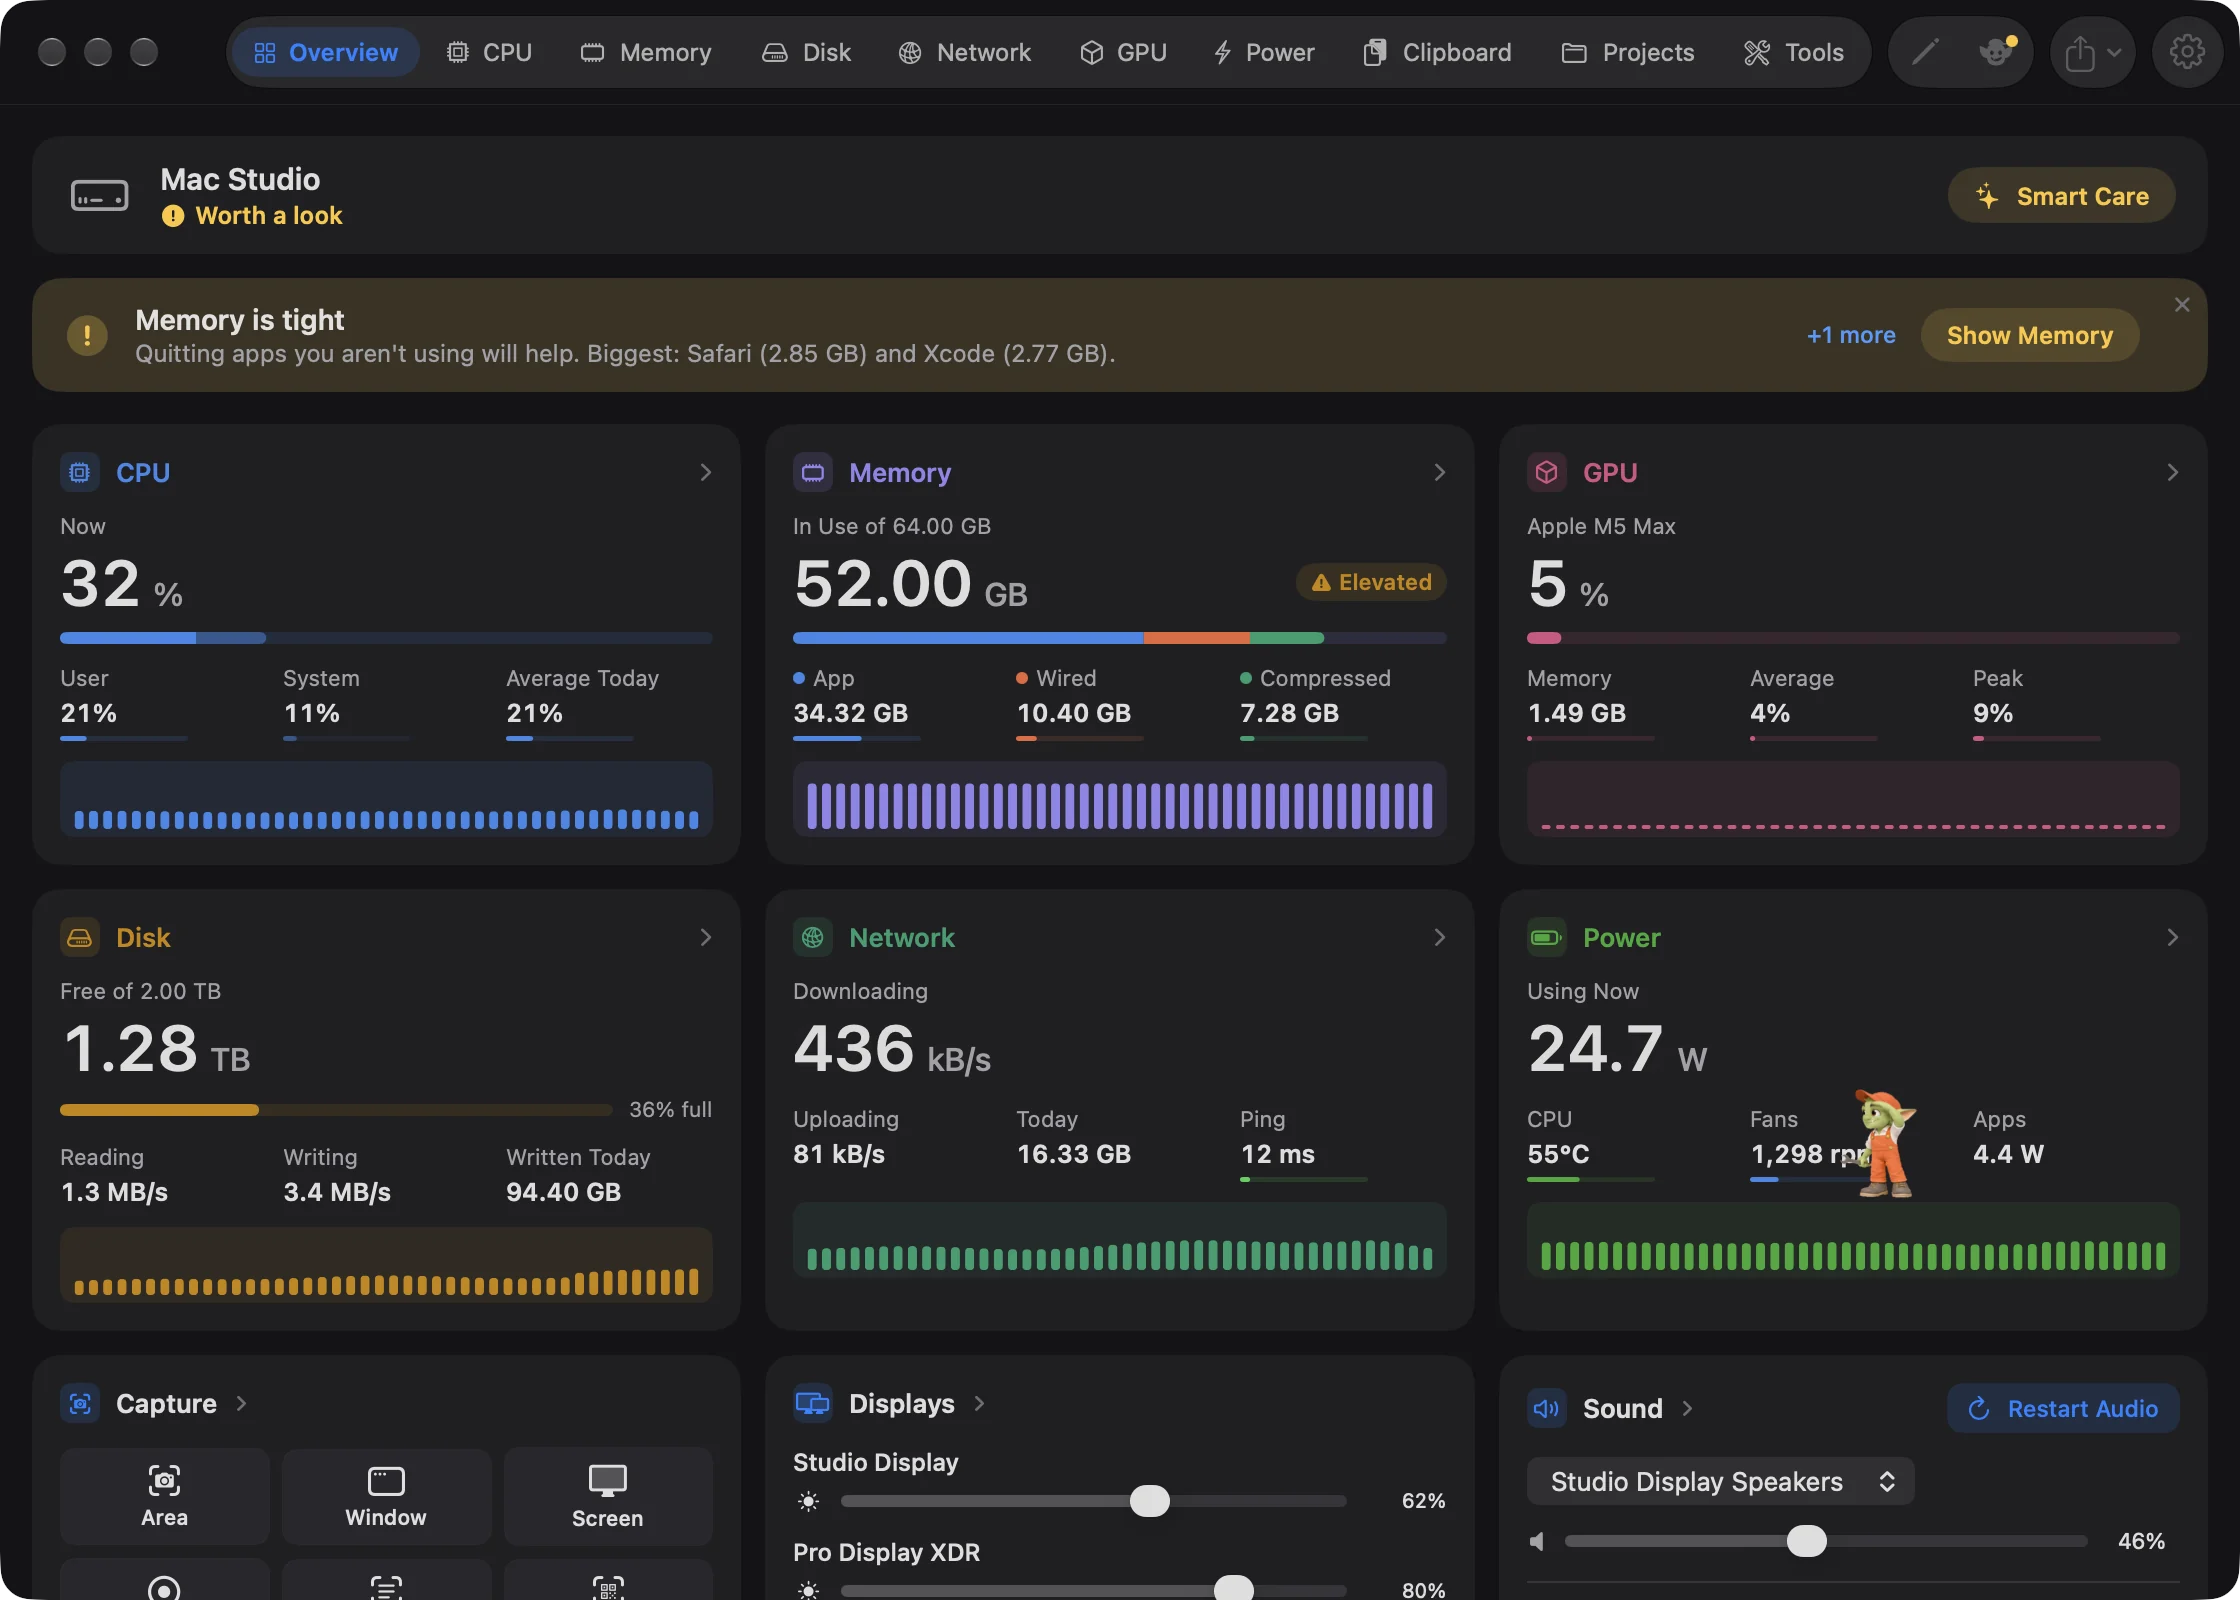
New: Coming in the next update. Each problem has a small × in its corner. The × on the top problem closes that one and the next moves up; every row under +2 more has its own. A closed problem stays closed until it clears and comes back. It's still counted in the Mac health line, and closing it doesn't fix it. A new problem brings the banner back with just that one.
The buttons, depending on the problem:
| Button | What it does |
|---|---|
| Quit app… | Asks before quitting the app that's causing the problem. |
| Show app | Opens that app's details on the right. |
| Show Memory, Show CPU, Show Disk… | Switches to that tab. |
| Stop It… / Stop Them… | Switches to Projects and asks before stopping the idle dev servers. |
| Empty Trash… | Asks "Empty your Trash?", then empties it with Goblin's spell. This can't be undone. |
| Clean Up… | Opens Disk›Cleanup. |
Quit always asks first. The question explains that Quit lets the app close and save first, while Force Quit ends it at once and loses unsaved changes. Cancel leaves it running. The banner never offers to quit the app you're using, one you've had in front in the last 15 minutes (or whose Terminal or editor you've used), or Goblin itself. It also offers to quit a given app only once; later problems about the same app offer Show app instead. After you quit an app or stop servers from the banner, that problem stays hidden for 15 seconds while the Mac catches up.
The banner also appears, in a smaller form, at the top of the menu bar panel. Its buttons close the panel and open the window on the right tab. In the panel, the buttons sit under the words, so a long button such as Show Microsoft Defender doesn't squeeze the words into a narrow column.
Every problem the banner can show, and the point at which each one appears, is listed on Health and alerts.
Figures cards#
Each of these cards shows a big figure, a bar, three smaller figures, and a strip of the last few minutes of readings. Click a card to open its tab.
| Card | Big figure | Smaller figures |
|---|---|---|
| CPU | Total processor use now. The bar splits your apps' share from macOS's, and turns red at 90%. | User, System, Average Today (since midnight). |
| Memory | Memory in use, out of the total. A chip shows memory pressure: Normal, Elevated or Critical. | App, Wired, Compressed. |
| GPU | How busy the graphics processor is. The card is captioned with the GPU's name. The bar turns red at 90%. | Memory (graphics memory in use), Average and Peak today. |
| Disk | Free space on the startup disk. The bar shows how full it is, red past 95%. | Reading, Writing, Written Today. |
| Network | Download speed now. | Uploading, Today (down and up since midnight), and Ping. |
| Battery | Charge. The caption says what the battery is doing. The bar turns orange at 20% and red at 10%. | The first two figures from the Battery page of Power (such as time left and power draw), and Health. |
The Network card shows Ping, your latency to the internet, while Check connection quality is on and has a reading. Otherwise it shows Last 7 Days.
On a Mac without a battery, the Battery card is called Power. It shows how many watts the Mac is drawing (Using Now), with CPU (processor temperature), Fans (the first fan's speed, or Off) and Apps (the watts your apps draw between them).
Connected drives on the Disk card#
New in 1.1: When an external drive is plugged in, the Disk card lists it under Connected Drives with its free space and an eject button. With more than one drive, Eject All ejects them all.
To eject a drive:
- Open the Overview (⌘1) and find the Disk card.
- Under Connected Drives, click the eject button beside the drive. With more than one drive, Eject All ejects every one.
When it worked, the drive leaves the list. If macOS refuses to eject a drive, its reason appears in red under the drive, for example when a file on it is still open. A successful eject plays a short sound while Settings›General›Sound effects is on. More on drives is in External drives.
Breakdown cards#
| Card | What it shows |
|---|---|
| Memory by Type | A ring of App, Wired, Compressed, Cached and Free, with the share in use in the middle. |
| Memory by App | The four apps using the most memory, macOS's own processes included, and Other. The middle shows how many apps are running rather than a total, because memory apps share is counted in each of them. |
| Power by App | The four apps drawing the most power, and Other, with the apps' total in the middle. If the whole Mac draws noticeably more than the apps (the display and other parts count too), a line says so. |
These cards rank apps by their average over the last 10 seconds, so the order doesn't reshuffle every second. Click a card to open its tab.
Worth a Look#
Worth a Look collects Goblin's alerts: an app busy in the background, an app that keeps growing in memory, a big Trash, a drive filling up, and so on. When there's nothing, it says "Nothing needs your attention."
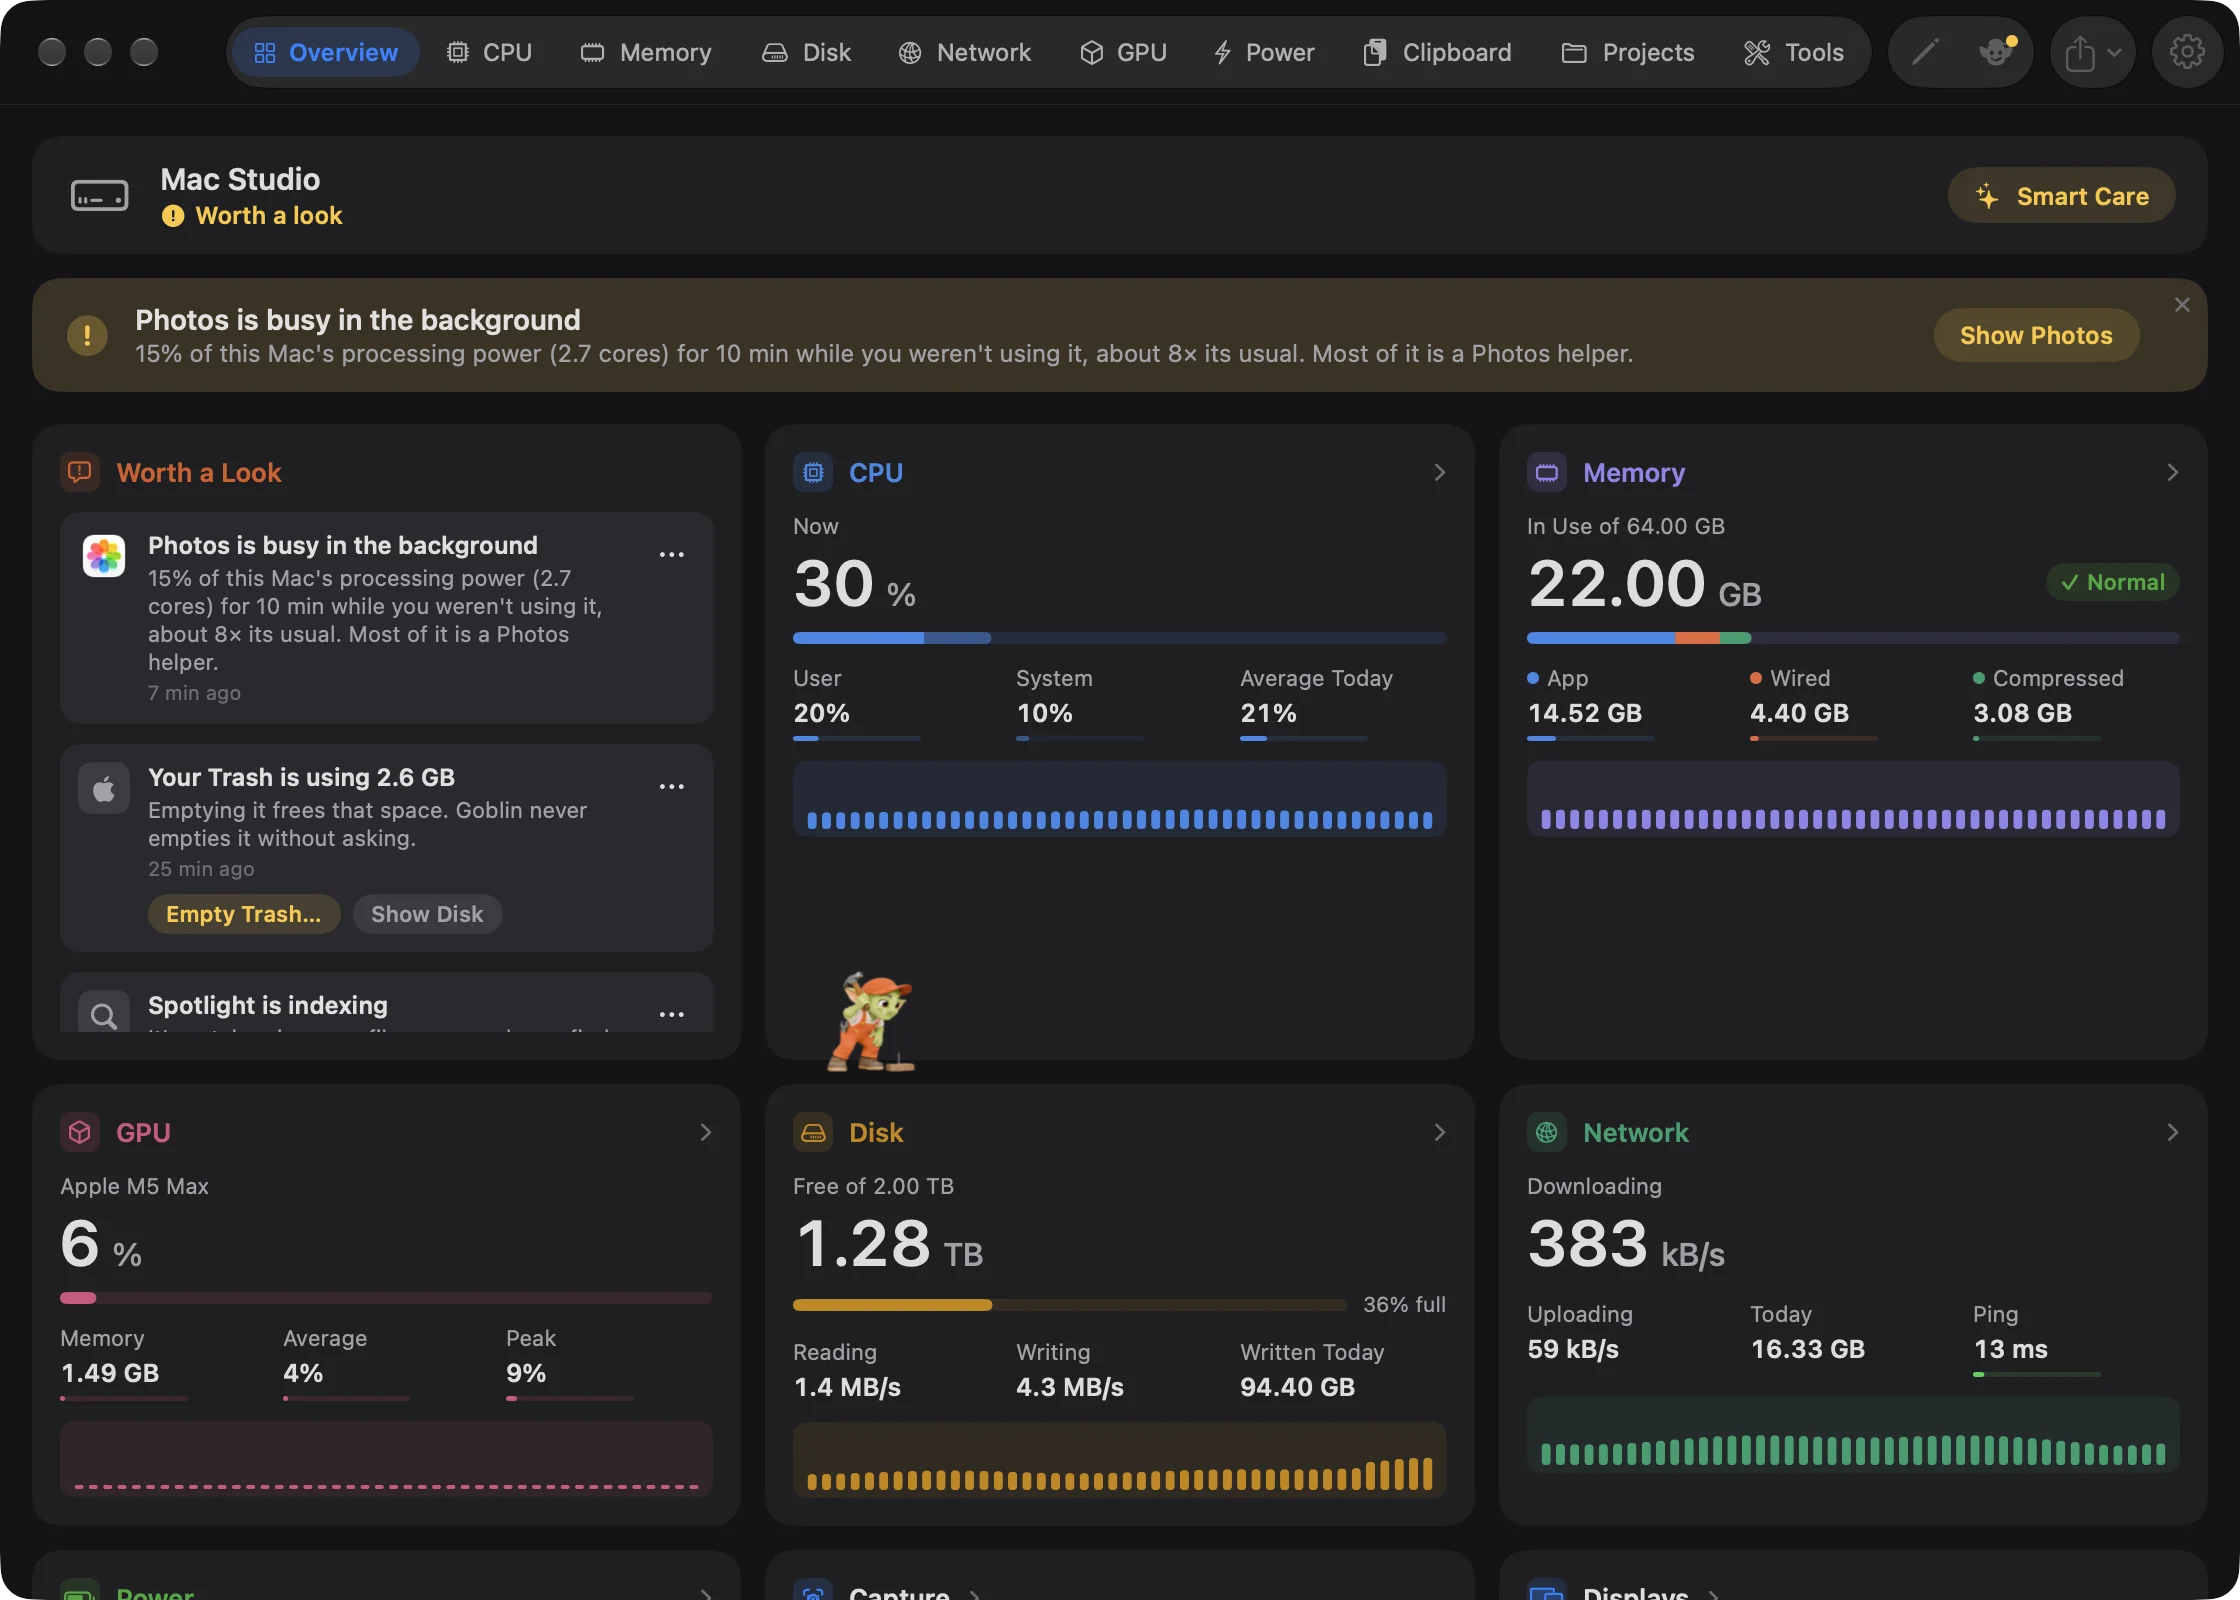
Each row shows an icon, a title, a sentence of detail and how long ago it happened. Up to 10 rows show, newest first. When the same kind of alert about the same app comes again, the rows fold into one that says · twice or · 3 times.
Click a row to open the app's details if it's running, or otherwise the tab the alert is about. Alerts about a big Trash also carry Empty Trash… and Show Disk buttons.
Each row's … menu offers:
| Item | What it does |
|---|---|
| Empty Trash… | On Trash alerts. Asks first, then empties the Trash. |
| Clean Up… | On startup-disk alerts. Opens Disk›Cleanup. |
| Show in tab | Opens the tab the alert belongs to. |
| Quit app… | While the app is running. Asks first. |
| Don't Alert About app | Stops alerts about this app and removes the row. For macOS's own jobs it reads Don't Mention job Again. |
| Dismiss | Removes the row, and its repeats, from the list and from history. |
Dismiss an alert or stop alerts about an app#
- On the Overview, find the alert in Worth a Look.
- Click the … at the right of its row.
- Choose Dismiss to remove just this row, or Don't Alert About app to stop alerts about that app.
Some alerts clear themselves: a low-battery alert once you plug in, a running-hot alert after half an hour, an alert about an app once it quits, and a dropped-connection alert once Goblin says it's back. What raises each alert, and how to undo Don't Alert About, is on Health and alerts.
Temperatures & Fans#
Tiles for the CPU and GPU temperatures, one for each fan with its speed, and the Battery temperature on a laptop. Temperatures are green below 70 °C, orange below 88 °C and red above. Below the tiles, CPU, last few minutes draws the recent processor temperature, next to a chip with macOS's verdict: Normal, Warm, Hot, slowing down or Very hot, slowing down. Click the card to open the Temperatures & Fans page of Power. Some Macs don't report temperatures; the card then says so.
Volume per App#
A slider for each app that's playing sound, from 0 to 150%. Double-click a slider to put it back to 100%. This card only appears while an app is playing sound (or has its volume changed), even when it's switched on in the layout. The first change asks macOS for permission to adjust app audio. See Sound.
Dev Servers#
One row for each coding project with a server listening on a port, biggest first: its name, its ports and memory, and idle in amber when it has done nothing for a while. The buttons open localhost in your browser, restart the server, or stop it; restart and stop ask first. With nothing running it says "No dev servers are running." Click the title to open Projects.
Tool cards#
New: Coming in the next update. Tool cards on the Overview.
After the figure cards, the Overview can show cards from the Tools tab, such as Capture, Displays, Sound, Keep Awake, Pick Color, Measure and Windows. Each works right where it is. Out of the box the Overview shows Displays, Sound, Keep Awake, Capture, Pick Color, Measure and Windows. To change which ones show, use the pin on a card while you arrange the Tools tab, or arrange the Overview with its pencil, as described next.
Choose your cards#
There are two ways: arrange the Overview in place, or use Settings.
Rearrange the cards on the Overview#
- Open the Overview (⌘1).
- Click the pencil (Edit Layout) in the toolbar. Every card turns dashed and goes to sleep, with an eye on its top edge, and a bar reads "Drag cards to rearrange the Overview. The eye shows or hides a card."
- Drag a card to where you want it.
- Click the eye to hide a card (it dims) or show it again.
- Click Done. Reset puts the cards back in their first order and shows them all.
The pinned tool cards sit in the Tools place, after the figure cards. Dragging a card onto one of them moves it to that place; tool cards move among themselves.
Choose cards in Settings#
- Open Settings (⌘,) and click Layout.
- At the top, next to Layout for, click Main Window.
- In the Main Window card, click a card to hide or show it, or drag it to a new place. Hidden cards are dashed and keep their place in the order.
- To move a card with the keyboard, select it and press ⌘← or ⌘→. Right-click for Hide, Show, Move Earlier and Move Later.
- Reset to Default puts every card back in its first order and shows them all.
Shown cards carry a number for their place. All cards show by default, in this order: Mac Health, CPU, Memory, GPU, Disk, Network, Battery, Tools, Memory by Type, Memory by App, Power by App, Worth a Look, Temperatures & Fans, Volume per App, Dev Servers. A card added in a later version of Goblin joins at the end of your order. Mac Health is the health line described above; the Tools card stands for all the pinned tool cards.
Window and panel layouts are separate#
The menu bar panel has its own layout, chosen with Menu Bar Panel at the top of the same pane. Changing one doesn't change the other, so you can keep a short panel and a full Overview, or the reverse. See Layout settings and The menu bar panel.
Copy Dashboard in the share menu takes a picture of your Overview cards in your order, tool cards included. It leaves out the Mac health line, Worth a Look, Temperatures & Fans, Volume per App and the drive list on the Disk card.