 Goblin
Click Goblin's menu bar item and a panel drops down with your Mac's figures, one tab per area. It's meant for a quick look: what's busy, how full the disk is, which dev servers are running, what the firewall blocked a moment ago. For history, charts and every detail, Open Goblin at the bottom takes you to the same tab in Goblin's window.
Open the panel#
- Click Goblin's item in the menu bar. The panel opens on the tab you last used.
- To close it, click the item again, press Esc, or click anywhere else.
Other ways in:
- A keyboard shortcut you turn on, from any app.
- A separate item, which opens the panel on its own tab.
- The Show Goblin Dropdown action in the Shortcuts app.
- If you can't see Goblin's item, see My menu bar item is hidden.
Around the edges#
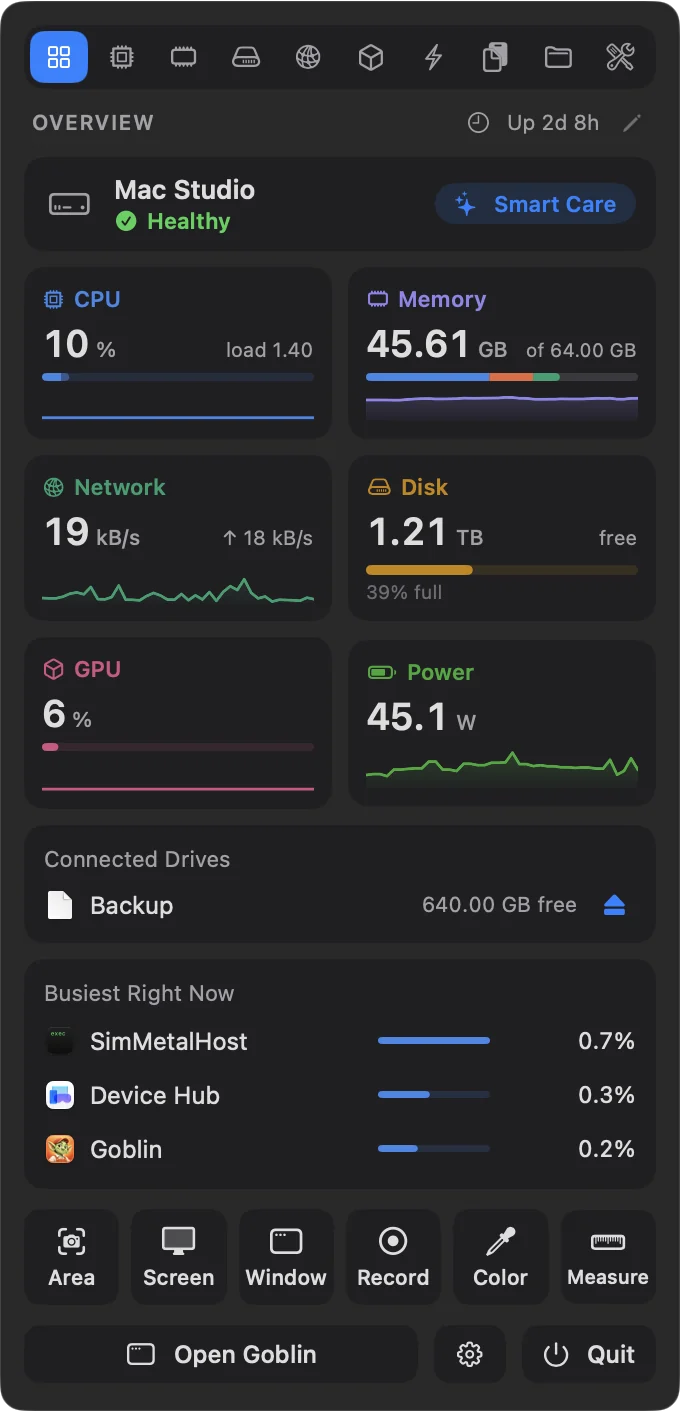
The tab bar at the top has one button per tab. In the default order they are Overview, CPU, Memory, Disk, Network, GPU, Power, Clipboard, Projects and Tools. Hover a button for its name. The selected tab is filled with its color. You can hide tabs or change their order in Settings › Layout; the window and the panel share the order.
Under the tabs is the tab's name in capitals. On Overview it also shows how long the Mac has been up, such as "Up 3d 4h". On Overview and Tools a small pencil at the right arranges the tab (see Arrange the Overview).
When a newer Goblin is waiting, a banner at the very top offers Update and Later. See Updates.
The quick buttons. Above the bottom row, every tab except Tools shows a row of up to six buttons, such as Color, Measure and Text. They are the first tools you've pinned (see Choose the dropdown buttons). While a screen recording runs, the row becomes the time recorded with Pause and Stop. To hide the row, turn off Show tools in the dropdown in Settings›Capture›General, under More.
The bottom row has three buttons:
- Open Goblin closes the panel and opens Goblin's window on the same tab. The window comes to the front and takes the keyboard focus, even over the app you were using, such as your browser.
- The gear closes the panel and opens Settings.
- Quit quits Goblin at once, without asking.
Beside them, Goblin can sit in the panel's bottom right corner. Click him to open Goblin AI. He's off until you turn on Goblin in the panel (see Extra rows from Settings).
Switch tabs#
Click a tab's button. Or press Tab for the next tab and ⇧Tab for the previous one, or ⌘1 … ⌘0 to jump straight to one (see below). Clicking an Overview tile opens its tab too.
Resize the panel#
New: Coming in the next update. Drag the panel's sides and bottom to resize it.
The panel is 340 points wide and as tall as the tab needs. To change that:
- Move the pointer to the panel's left or right edge, or its bottom edge. The pointer turns into a resize arrow.
- Drag. The left and right edges make it wider, up to 720 points. The bottom edge makes it taller; the tab grows to that height before its contents scroll, and the Clipboard list fills it.
- To put it back, double-click an edge.
Goblin remembers the size you set. A larger text size in Settings › Appearance grows the panel with it.
Keys inside the panel#
| Key | What it does |
|---|---|
| Esc | Closes the panel. |
| Tab / ⇧Tab | Next tab / previous tab, wrapping around at the ends. |
| ⌘1 … ⌘9, ⌘0 | Jumps to the first to ninth tab, in tab-bar order; ⌘0 to the tenth. |
| Return | In a dev server's details, opens it in the browser. |
In the default order, Clipboard is the eighth tab, Projects the ninth and Tools the tenth.
On the Clipboard tab, while Clipboard is on, ⌘1 … ⌘9 paste clips instead of switching tabs, and Esc closes a preview, then clears the search, and only then closes the panel. Tab and ⇧Tab still switch tabs. The tab's other keys are under Clipboard below.
Overview#
The Overview is a summary of the whole Mac. From top to bottom:
The health line#
New in 1.1: A one-line verdict on your Mac at the top of the panel.
It shows your Mac's name and one of "Healthy", "Worth a look" or "Needs attention" ("Checking…" while it works it out). The Smart Care button closes the panel and opens Smart Care. If something needs a look, or Smart Care has never run, it starts a scan for you. The line appears while the health check is on and Show it in the menu bar panel is on in Settings › Health Check. Both are on by default. It's one of the Overview's cards, called Mac Health while you arrange them, so you can also hide it there.
The status banner#
When something isn't right, a banner names the most important issue with a button to fix it. +2 more shows the rest, and Show less folds them away. Each problem has a small × in its corner that closes it until it clears and comes back (the next one moves up), and its buttons sit under the words to leave room for long names. It's hidden while everything is fine, or once you've closed every problem. Every issue it can raise is listed in Health and alerts.
Tiles and boxes#
Next come small tiles, two to a row, and wider boxes. Click a tile to switch to its tab.
| Tile | Big figure | Underneath |
|---|---|---|
| CPU | Load in % | The load average, a user/system bar and a short graph |
| Memory | Memory in use | "of 32 GB", or the memory pressure in color while macOS reports any, with a bar and a short graph |
| Network | Download speed | Upload speed and ping, with a short graph |
| Disk | Free space | How full the disk is, with a bar that turns red past 95% |
| GPU | Graphics load in % | A bar and a short graph |
| Battery | Charge in % | How long it should last and the charging state. Called Power on Macs without a battery, where it shows watts. |
| Temperature | Processor temperature | The fastest fan, "Fans off", or the thermal state, with a graph |
| Clipboard | Clips in your history, or Off while Clipboard is off | Clipboard |
| Projects | Dev servers running | Idle servers in amber, or ports in use, and up to three project names |
| Containers | Containers running | Docker. Only on a Mac with Docker. |
| Sound | Apps playing sound | — |
| Displays | How many displays | Display Controls |
| Tools | How many tools are pinned | Tools |
The boxes:
New in 1.1: The Connected Drives box.
- Connected Drives lists each external drive with its free space and an eject button (⏏). With more than one, Eject All ejects them all. If macOS refuses to eject a drive, its reason appears under the drive in red. The box shows only while a drive is connected.
- Busiest Right Now lists the three apps using the most processor time, leaving out macOS's own processes.
- Volume per App appears while apps are playing sound, with a volume slider for up to four of them, from 0 to 150%. Double-click a slider's percentage to put it back to 100%. Click the box's title to open the Sound page of the Tools tab.
By default the Overview shows the health line, CPU, Memory, Network, Disk, GPU and Battery, then Connected Drives, Busiest Right Now and Volume per App. Temperature, Clipboard, Projects, Containers, Sound, Displays and Tools tiles are there to add.
Arrange the Overview#
New: Coming in the next update. Arrange the Overview right in the panel.
- Open the panel on Overview and click the pencil at the right of the title row. Every tile and box this Mac can show comes out, drawn asleep with a dashed edge, and a note explains: "Drag onto another to move. Click a check to leave it out."
- Drag a tile onto another to take its place.
- Click the check in a tile's corner to leave it out. A tile that's left out is dimmed; click its plus to bring it back.
- Click Done.
Reset in the note puts the default layout back (it's greyed out when nothing has changed). You can also do this in Settings›Layout with the Menu Bar Panel layout. See Settings › Layout.
Eject a drive#
- Plug in the drive. The Connected Drives box appears on the Overview.
- Click the eject button (⏏) beside the drive, or Eject All if you have more than one.
- When macOS refuses, the reason appears under the drive in red. Close whatever is using the drive and try again.
App rows#
App lists in the panel, such as Busiest Right Now and every tab's Top Apps, work the same way. Hover a name for a card with more about the app. The list holds still while the pointer is over it, so rows don't jump as you aim. Click a row to open that app in Goblin's window (see Inspecting an app).
To quit an app from a row, right-click it and choose Quit followed by the app's name and "…" (it isn't offered for macOS's own processes). Goblin asks you to confirm first: Quit asks the app to close and save, Force Quit ends it at once and loses unsaved changes, and Cancel leaves it. The same menu has:
- Show Details
- Show in Finder (not for macOS processes)
- Copy › with Path, Process IDs and Summary
- Logs
- Export CSV…, which saves the app's history over a Time range: you pick, from Right Now to Last 30 Days (Last Hour to start with). See Export and share.
CPU, Memory, Disk and GPU#
Each of these tabs starts with a card holding the main figure and a short graph, then lists the five apps using the most of it.
| Tab | Main card | App list |
|---|---|---|
| CPU | Load %, the chip's name, User, System and Load Average | Top Apps |
| Memory | Memory in use, the total, a pressure label, App, Wired, Compressed and Swap Used | Top Apps |
| Disk | Free space, used of total and how full, Reading and Writing | Top Apps by Disk |
| GPU | Graphics load %, the GPU's name, GPU Memory in Use, and Temperature when the Mac reports it | Top Apps |
New: Coming in the next update. A Trash card on the Disk tab. While The Trash is getting big is on and your Trash holds more than the size set in Settings › Alerts, the tab shows its size, how many items it holds and an Over 10 GB-style chip, with Empty Trash. The button asks once more, in the card, with Confirm and Cancel. The card stays while the Trash is big, even after you close the warning.
What these figures mean is explained on the CPU, Memory and GPU pages.
Network#
- Download and upload speed with a graph, how much came in Today, and the Interface in use.
- Connection: a grade for your connection with Ping, Loss, Jitter, and Wi-Fi signal (or the Interface on a wired connection). It shows while measure connection is on in Settings › General, which it is by default.
- Top Apps by Network.
- Addresses, if you turned it on (see Extra rows from Settings).
- The firewall card, while the firewall is on (below).
The readings are explained in Network activity.
The firewall card#
While the firewall is on, the Network tab ends with a FIREWALL card:
- Operation Mode: a menu with Alert, Silent Allow and Silent Deny, and a line explaining the current one.
- Two round buttons: Sound rules on or off, and filtering on or off. With filtering off, the card says "Filtering is off: watching only, everything is allowed."
- Profile, if you have profiles: No profile or one of yours.
- A five-minute traffic chart, sent in purple above the line and received in blue below it. Click it to open Network›Connections.
- Recent Network Activity: up to three apps moving at least 1 kB/s, or "None right now". Click to open Connections.
- N connections waiting for your answer, when connection alerts are waiting. Click to bring the alerts back.
- Recently Denied: a red count and up to three recent denials such as "Safari → example.com 3×". Click one to open Rules on what denied it. "None within the last 5 minutes" when there are none.
- Manage Rules…, Connections and a gear that opens the Firewall pane of Settings.
If the network extension isn't running, a line says what state it's in. Changing the mode, filtering or profile may ask you to authenticate if your rules are locked. To hide the card, turn off Show the firewall in the menu bar panel's Network tab in Settings›Firewall›Status Menu; see Firewall settings.
Power#
New: Coming in the next update. Battery and Thermals are now one Power tab. A switcher at the top of the tab chooses between the battery page and the temperatures page.
The switcher at the top has two choices: Battery (called Power on a Mac without a battery) and Temperatures & Fans. Click one to change page.
Temperatures & Fans page#
- The temperature card: the processor's temperature with a state label (Normal, Warm, Hot, slowing down or Very hot, slowing down), a graph and a gauge, then rows for the GPU, the hottest sensor (named for the part it's in, such as CPU, with Hottest beside it), and each Fan with its speed or "Off". Macs that don't report temperatures say so.
- Making the Most Heat: what the whole Mac is drawing in watts ("Whole Mac 12.3 W"), then the three apps using the most power. Click one to open it in Goblin's window.
- Power, if you turned it on (see Extra rows from Settings).
More in Thermals.
Battery page#
With a battery, the page shows its charge, state, time left, health and connected devices (see Battery). On a Mac without a battery, the page is called Power and shows what the Mac is drawing now, in watts. Below that comes the Keep Awake card, then Top Apps by Power.
New in 1.1: The Keep Awake card on this tab starts and stops sessions. See Keep Awake basics.
Clipboard#
New in 1.1: The panel's Clipboard tab, a compact version of the clipboard strip.
While Clipboard is off, the tab shows a card that explains what it does, with Turn On Clipboard. Once it's on, the tab lists your clips, newest first:
- A search field at the top, always ready for typing, with a filter button and + for a new text item.
- Chips for History, each pinboard and the Trash.
- One row per clip, with its icon, title, the app it came from and when, and its number for the first nine.
- A footer with the status ("Capturing" or "Paused", plus the sync status when iCloud sync is on) and small buttons: Open Strip, Open in Window, Copy Queue, pause or resume capturing, presentation mode and More.
Click a row to paste it into the app you opened the panel over. ⌥-click copies it without pasting, and ⇧-click pastes it as plain text. Right-click a row for the same menu as in the strip, or drag it into another app or onto a pinboard's chip.
| Key | What it does |
|---|---|
| ⌘1 … ⌘9 | Pastes the first to ninth clip. Add ⇧ to paste as plain text. |
| ↑ / ↓ | Moves through the list. ⌘↑ and ⌘↓ jump to the top and bottom. |
| Return | Pastes the selected clip. ⌥Return copies it, ⇧Return pastes plain text. |
| Space | Previews the selected clip, while the search is empty. |
| ⌘⌫ | Deletes the selected clip. |
| ⌘C | Copies the selected clip, while the search is empty. |
| ⌘N | A new text item. |
| Esc | Closes the preview, then clears the search and filters, then closes the panel. |
⌘ and ⇧ are the Quick Paste and plain-text modifiers from Settings › Clipboard; if you change them, the keys change here too. While Clipboard's presentation mode is on, the panel is left out of screenshots and screen sharing for as long as it shows this tab. Everything else about clips is in The Clipboard tab and The clipboard strip.
Projects#
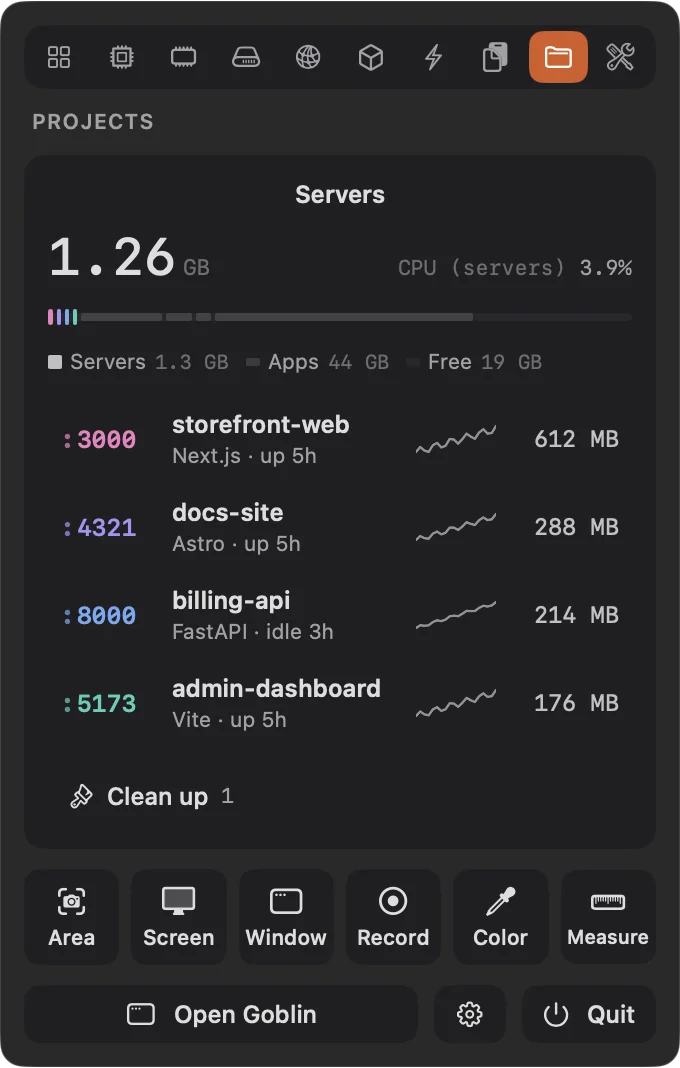
The Projects tab is about the dev servers running on your Mac. The full story, including how Goblin finds them, is on Projects and dev servers.
- At the top, the memory your servers hold in total, their CPU, and a bar of the Mac's memory: each server as a raised block in its port's color, other apps and "Everything else" below, and free memory as the empty part. Hover any piece for its name and size, or click a server's block to open its details.
- One row per server with its port (amber when it's leaking memory), its name, what it is and how long it's been up or idle, a memory trend and a figure. Hover a row for two buttons: open it in your browser, or stop it. Click a row for its details. Up to six rows show before the list scrolls.
- Clean up shows a count of servers that look left over. Click it to tick servers and stop them together. Servers that are idle, or whose folder or worktree is gone, are ticked for you. Databases and leaking servers are never ticked for you. Stop N servers · free X stops them politely, never by force; Cancel leaves them.
A server's details show its port, how long it's been running, Restart and Stop buttons, its branch and folder, more rows behind N more, memory and CPU charts, and its processes. Open localhost:3000 (or whichever port) is the main button, so Return opens it. The … menu has the rest: copy the URL or command, open it in Terminal, show it in Finder, show its logs. Goblin remembers whether you left N more and the processes open.
With nothing running, the tab says "Nothing listening".
Stop a dev server#
- Open the Projects tab.
- Hover the server's row and click the stop button (a filled square) that appears. Goblin stops it and says "Stop requested for" its name.
- To stop several at once, click Clean up, tick the servers, and click Stop N servers · free X.
Stopping is polite, never by force. To restart a server with the same command, open its details with a click and use Restart.
Containers#
New: Coming in the next update. Containers is a page of the panel's Projects tab.
When Docker is installed, a switcher at the top of the Projects tab chooses between Projects and Containers, a compact version of Containers. Sound moved to the Tools tab; see Sound.
Tools#
New: Coming in the next update. The panel's Tools tab.
Every tool once, as small tiles two to a row and wider boxes across the panel, as the Overview lays out its figures. Anything that needs the screen, such as a capture, Measure or Pick Color, closes the panel first. The panel's row of quick buttons is left off this tab, since its buttons are all here. See The Tools tab.
To choose which tools show and in what order:
- Click the pencil at the right of the title row. Every tool comes out asleep.
- Drag one onto another to take its place, and click the check on a tool's corner to leave it out or bring it back.
- Reset puts the default back, and Done finishes.
Extra rows from Settings#
The Dropdown card in Settings›Menu Bar adds three optional extras to the panel:
| Setting | What it does | Default |
|---|---|---|
| Addresses on the Network tab | Adds an Addresses card to the Network tab with this Mac's IPv4 and IPv6 addresses, Router and Interface, plus your Public address if public IP lookup is on in Settings › General. You can select the text to copy it. | Off |
| Power on the Temperatures page | Adds a Power card to the Temperatures & Fans page of the Power tab with System, Processor, Graphics, Neural Engine and Memory power, and what the charger and battery are doing (Power in, Voltage, Current). It shows only when the Mac reports more than the whole-Mac figure. | Off |
| Goblin in the panel | Keeps the Goblin at the bottom right of the panel. Click him to open Goblin AI. | Off |
To turn one on, open Settings›Menu Bar, scroll to the Dropdown card, and switch it on.
The Addresses card sits at the end of the Network tab, after Top Apps by Network and before the firewall card. Offline, it shows only "Interface: Offline".
Give the panel its own colors#
New in 1.1: The panel can have a color theme of its own.
By default the panel uses the same color theme as Goblin's window. To give it its own:
- Open Settings›Appearance.
- In the Colors card, turn on Separate menu bar panel (off by default).
- Two pickers appear, Window and Menu bar panel. In the Menu bar panel one, choose Standard, Mono, Inverted, Color or Glass.
- For Inverted, Color and Glass, choose a color: Purple, Blue, Teal, Green, Orange, Rose, Graphite or Custom….
The panel starts as Glass in Purple: tinted glass with your desktop showing through. Color and Glass are always dark and Inverted is always light. Standard and Mono follow your light or dark choice. More in Settings › Appearance.
Uninstall applications correctly#
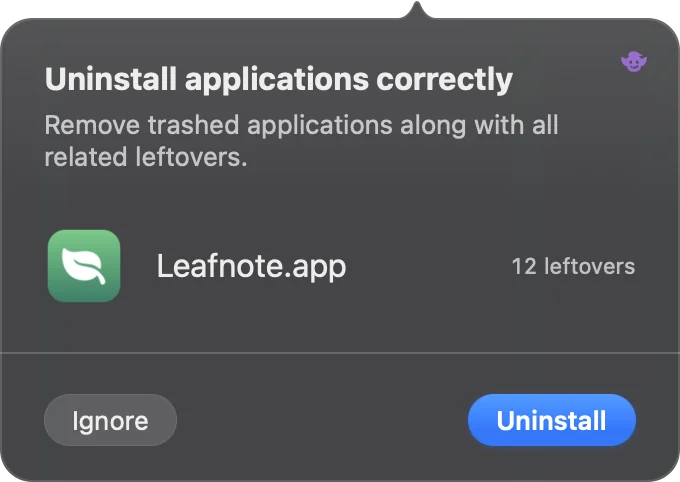
New in 1.1: Goblin offers to remove what an app leaves behind when you drag it to the Trash.
When you move an app to the Trash, or delete one that leaves files behind, a small dropdown appears under Goblin's menu bar item titled Uninstall applications correctly. It lists each app with its icon and how many leftovers Goblin found, such as "12 leftovers". It doesn't take the focus from what you're doing.
- Uninstall opens Disk›Applications with a review of those apps and their leftovers. Nothing is removed until you confirm there. See Uninstalling apps.
- Ignore closes it, and Goblin won't ask about those apps again.
Clicking anywhere else closes it too. If you trash another app within 8 seconds, the dropdown comes back with all of them. Apps you trash together share one dropdown, with up to five rows showing before the list scrolls.
Goblin doesn't ask about Apple's own apps, apps you've told it to ignore, the same app again within 15 seconds, or a copy of an app that's still installed somewhere else on the Mac (unless the trashed copy still has a system extension installed, which would keep running).
This is the one dropdown that needs Goblin's item to be in the menu bar. If the item isn't visible, for example because the notch hides it, Goblin's spell stands in (while Play Goblin's spell when an app is deleted in Finder is on), or else a notification. See Uninstall from Finder.
To turn it off:
- Open Settings›Alerts and scroll to the last card.
- Switch off Offer to uninstall apps moved to the Trash (on by default).
The same card shows how many apps you've ignored, with Ask Again to clear the list. Watching the Trash needs Full Disk Access; without it Goblin still notices apps removed from the Applications folders.
Other dropdowns open the same way: one offers to force quit apps that stop responding, others to free memory, empty a big Trash, or fix a shortcut clash. See Alert dropdowns.