 Goblin
The CPU tab shows how hard the processor is working and which apps are keeping it busy. Use it when the Mac feels slow, the fans spin up, or you want to know what's running in the background. The app list at the bottom is the same one the Memory, GPU, Power and Network tabs use, so what you learn here works there too.
Find what is using the processor#
- Click CPU in the tab bar of the main window, or press ⌘2.
- Look at the big figure at the top. It is total processor use now, out of 100% for the whole Mac.
- Scroll to the app list. It is sorted busiest first, so the app at the top is using the most.
- Click that app's row to see which of its processes are busy, or double-click it for its details.
When it worked, you see the busiest app and its share of the processor. If the busy app is yours to close, see Quit an app from the list.
The processor now and over time#
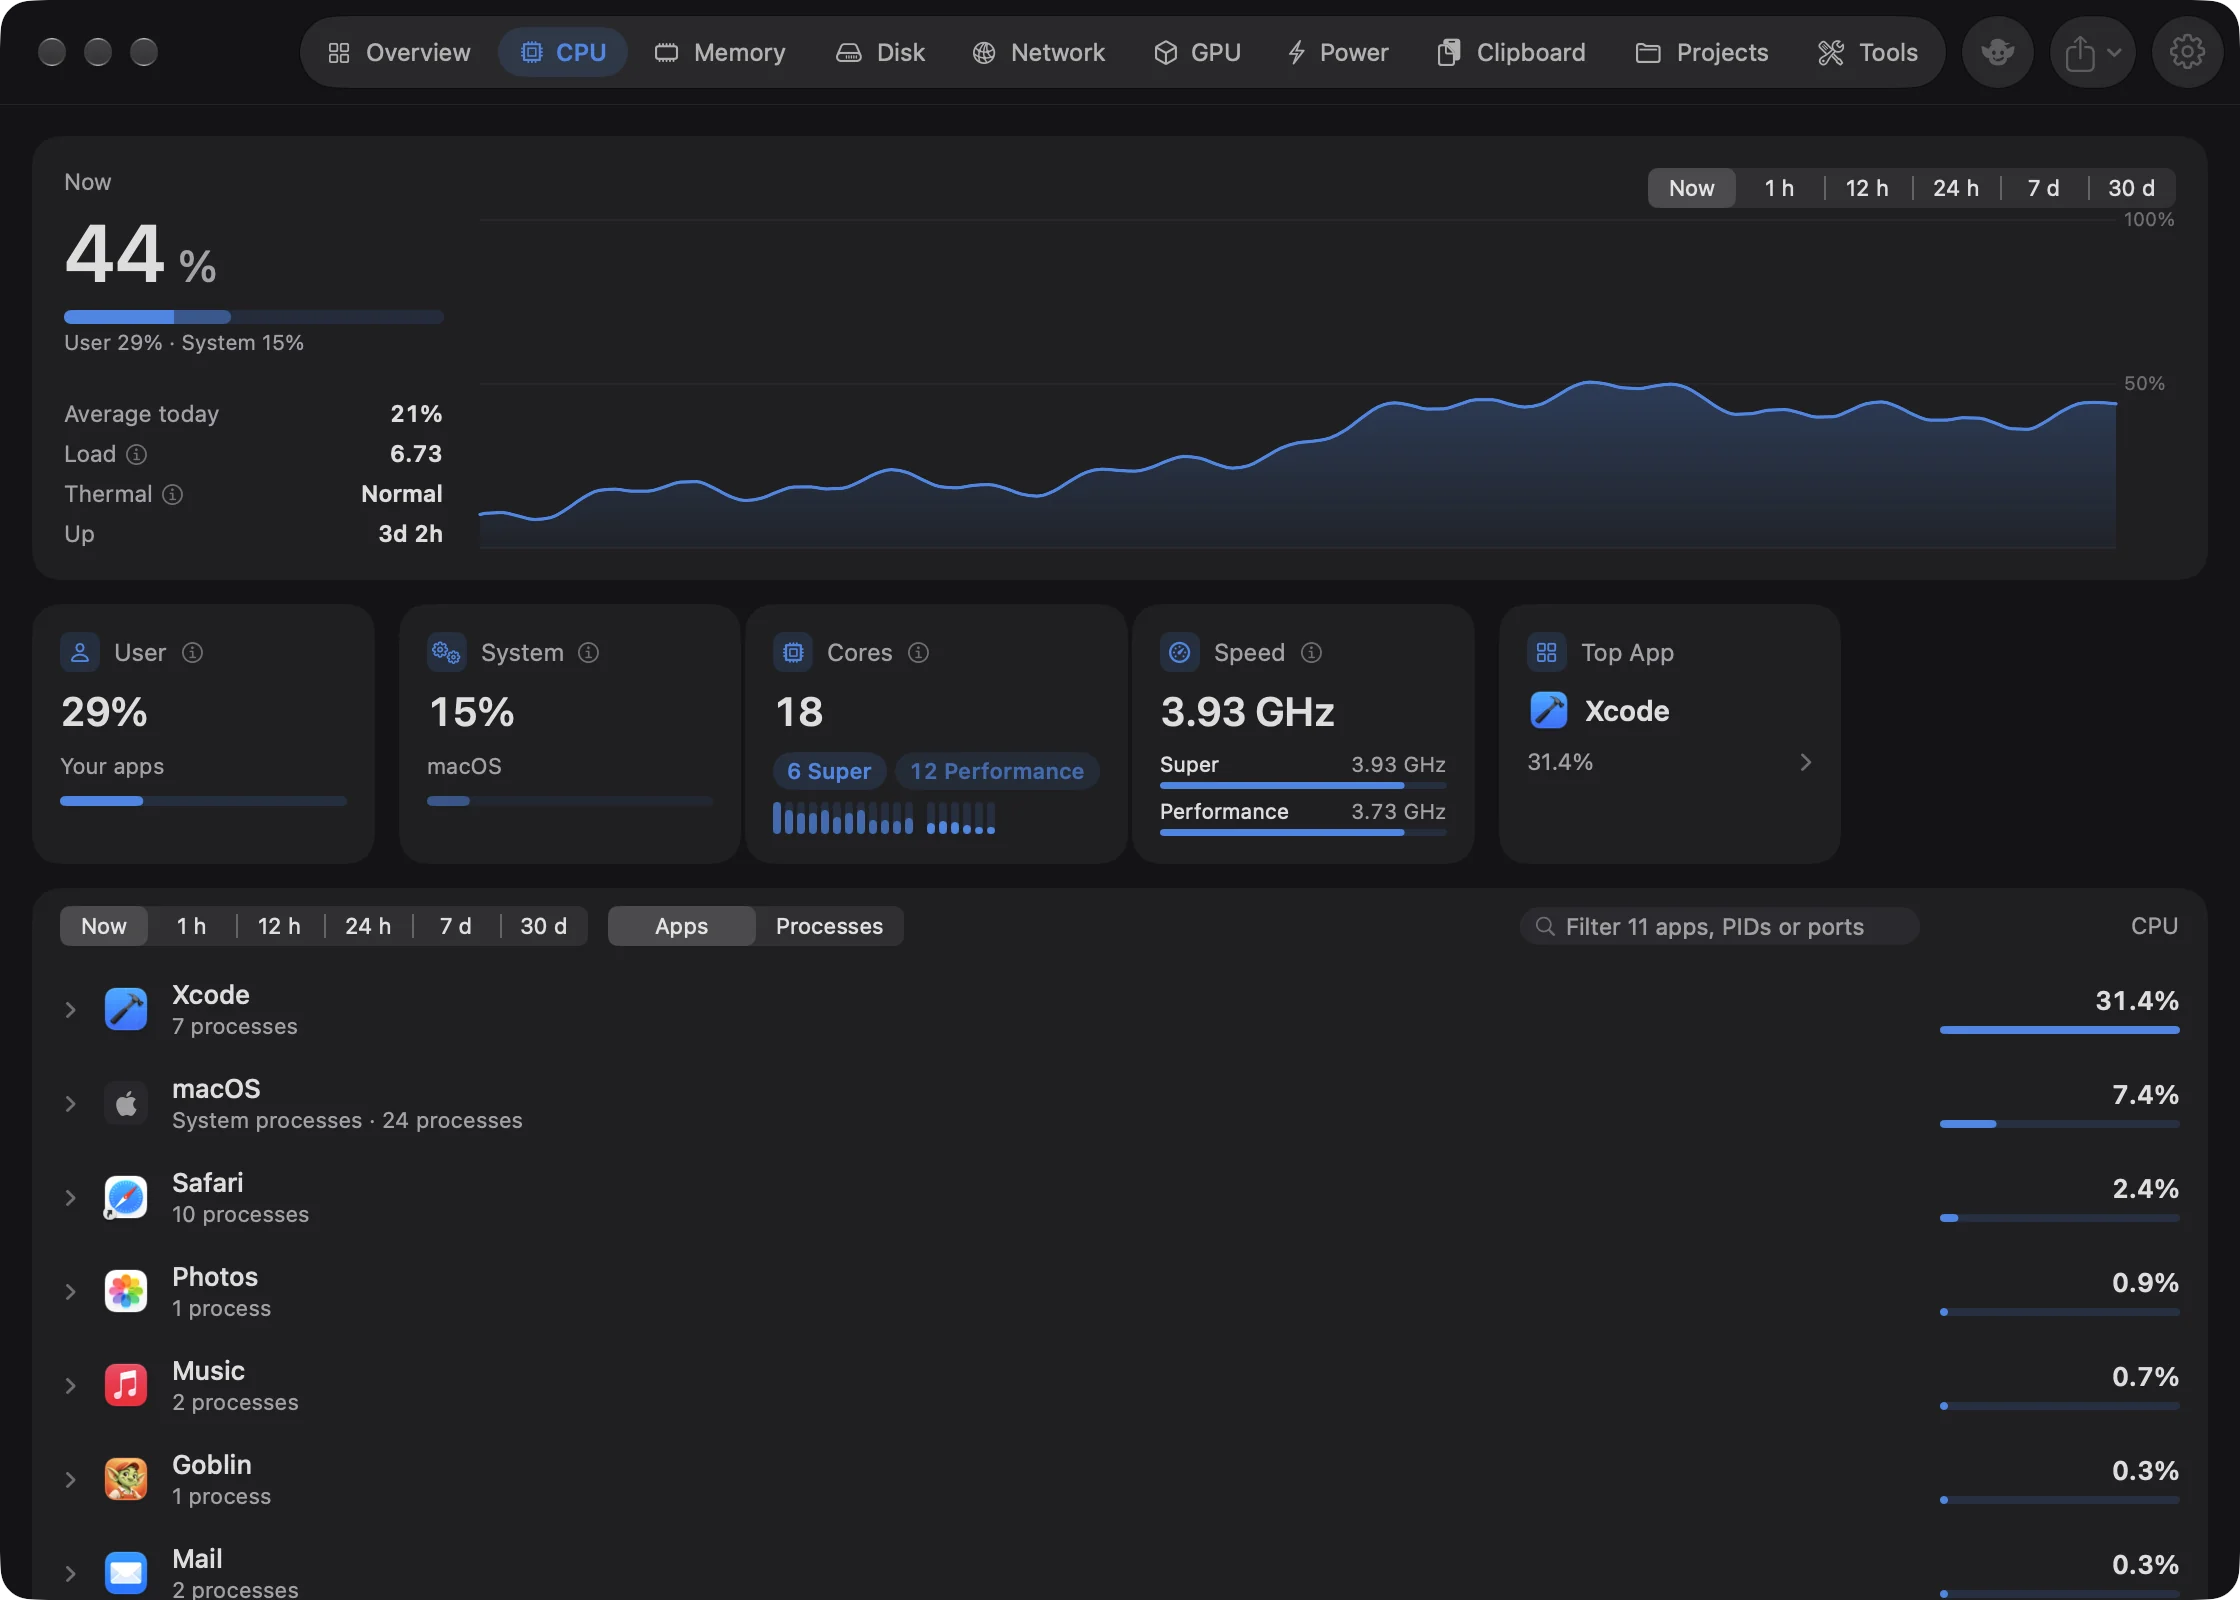
The big figure is total processor use Now, out of 100% for the whole Mac. The bar under it is split between your apps and macOS, and turns red at 90%. The line under the bar gives both shares, for example "User 34% · System 8%".
| Row | What it shows |
|---|---|
| Average today | Average processor use since midnight, from Goblin's history. |
| Load | The one-minute load average: how many tasks are running or waiting for the processor. Lower than the number of cores means there's room to spare. |
| Thermal | macOS's verdict on heat: Normal, Warm, Hot, slowing down or Very hot, slowing down. See Thermals. |
| Up | How long since the Mac last started, such as "3d 4h". |
Click the ⓘ next to Load or Thermal for a short explanation.
Choose a time range#
- Open the CPU tab.
- Click a time above the chart: Now, 1 h, 12 h, 24 h, 7 d or 30 d.
The chart and the app list change together. The buttons switch between Now, 1 h, 12 h, 24 h, 7 d and 30 d.
- Now shows the last five minutes, read every second while the window is in front.
- The other ranges come from Goblin's history and add up that stretch of time. Goblin only records while it's running, so time when it wasn't leaves a gap. See History settings.
The same buttons sit above the app list, and the two always match. When there's nothing to draw yet, the chart says "Collecting…", "Loading…", or "No history yet. Goblin records while it runs."
The cards#
| Card | What it shows |
|---|---|
| User | Time the processor spends running your apps. |
| System | Time it spends running macOS itself on behalf of your apps. |
| Cores | How many cores the processor has, with a bar for each core's load right now. |
| Speed | How fast the cores are running right now. Only on Macs that report it. |
| Top App | The busiest app that isn't part of macOS. Click it to open its details. |
Cores#
On a chip with more than one kind of core, chips name each group the way macOS does, fastest first, such as "4 Performance" and "6 Efficiency" (newer chips may say "Super"). When Goblin can tell which core belongs to which group, the bars are grouped, with the faster groups drawn stronger. Rest the pointer on a bar to see, for example, "Efficiency core 2, 14%".
Performance cores do the heavy work; efficiency cores handle background jobs while using less power.
Speed#
The big figure is the current clock speed of the fastest group of cores, such as "3.85 GHz", or Idle when every core in it is asleep. Below it, each group has its own speed and a bar showing where it sits in its range. Cores slow down when there's little to do and speed up for heavy work, so this figure moves a lot. On Intel Macs the card shows the processor's Rated speed instead.
Goblin only measures clock speed while its window or panel is on screen.
The app list#
The list at the bottom shows what's using the processor, busiest first. Apps that use exactly the same amount are ordered by memory, then by name.
Apps or processes#
To see every process on its own, or go back to one row per app:
- Scroll to the app list.
- Click Processes (or Apps) above the list.
Your choice is remembered, and applies on every tab with an app list.
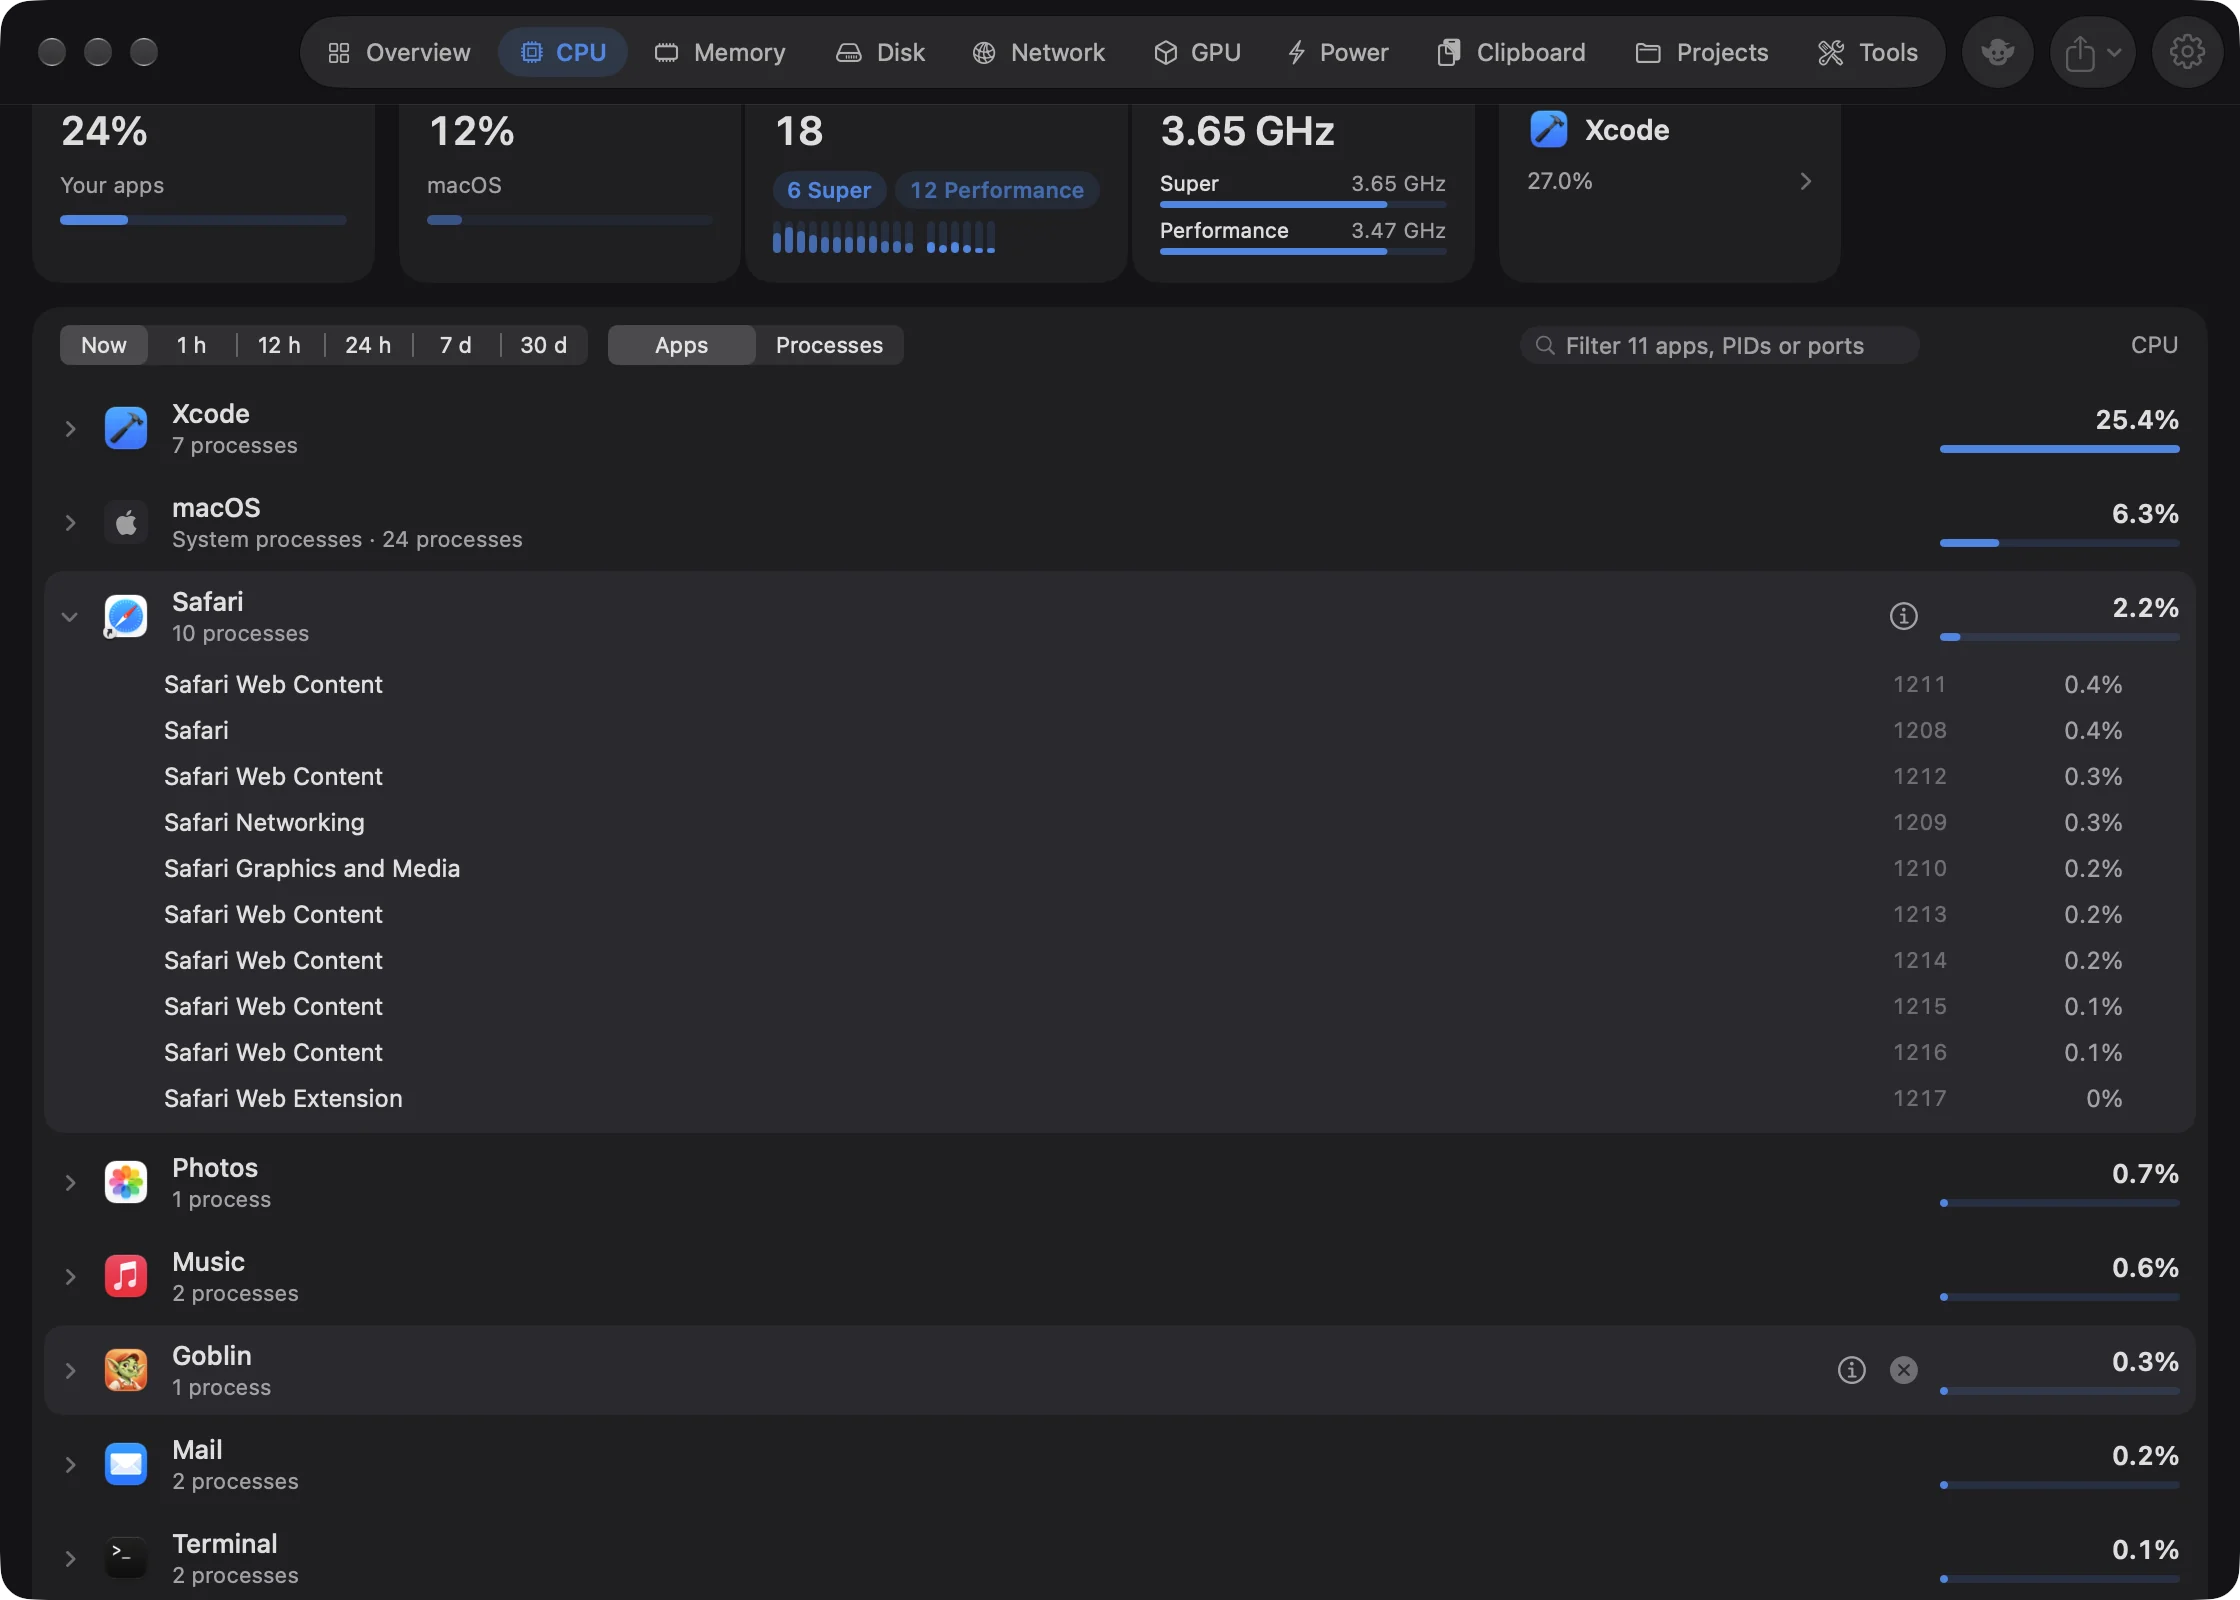
- Apps adds each helper process to the app it belongs to. A browser with 30 helper processes is one row. macOS's own processes are gathered into one row called macOS.
- Processes lists every process on its own, with the app it belongs to and its process ID (PID).
The list shows the first 40 apps or 60 processes. Show All at the bottom shows the rest. While you're filtering, every match shows.
Find an app, a process or a port#
- Click the filter field above the list ("Filter 312 apps, PIDs or ports").
- Type part of a name, a process ID, or a port such as
3000or:3000. - Click ✕ in the field to clear it.
The filter narrows the list. It matches app names, process names, a process ID, or a port a process is listening on (type 3000 or :3000). When an app matches because of one of its processes, its row says "includes" and the process name. Click ✕ in the field to clear it.
Reading a row#
In Apps mode, each row shows the app's icon and name, how many processes it has, and any ports it listens on (such as "port 3000, 5173"). On the right are its share of the processor and a bar compared with the busiest app.
Change how an app's share reads#
- Open Settings (⌘,) and click General.
- In the App CPU card, click Share of this Mac (the default: the whole Mac is 100%) or Per core (one busy core is 100%, so a busy app can show more than 100%).
The setting affects every app list.
Figures under 0.05% show as "0%".
Looking closer#
- Click an app row to show its processes, busiest first. A long list shows 12, then Show n More.
- Double-click a row, or click the ⓘ that appears when you point at it, to open the app's details on the right. See App Inspector.
- Rest the pointer on a name for a moment to see a card with the app's or process's figures.
- Processes macOS uses for well-known jobs carry an ⓘ that says what they do, such as
WindowServerormds_stores. - A 🔒 means the process belongs to another user or to macOS. Goblin reads its memory and processor use with macOS's
pstool; its disk and power use can't be measured.
While the pointer is over the list, a menu is open or an app is expanded, the rows hold still so nothing moves under your click. They slide into order a moment after you move away.
Right-click menus#
| On | Items |
|---|---|
| An app | Show Details…, Show Logs, Quit app…, Show in Finder, Copy Name, Copy Process IDs |
| A process inside an app | Show Logs, Quit Process…, Show in Finder, Copy PID, Copy Path |
| A row in Processes mode | Show app Details…, Show Logs, Quit Process…, Quit app…, Show in Finder, Copy PID, Copy Path |
Show Logs opens what the app or process has written to the system log. See Logs. Quitting isn't offered for macOS's own apps.
Quit an app from the list#
- Open the tab (for example CPU) and point at the app's row.
- Click ✕ at the right of the row. For a single process inside an expanded app, click its ⊗. Or right-click the row and choose Quit app….
- In the question that appears, choose what to do. Goblin always asks first:
- Quit asks the app to close, so it can save your work first.
- Force Quit ends it at once, along with all its helper processes. Unsaved changes are lost.
- Cancel leaves it running.
When an app has quit, a message at the bottom of the window says how much memory it freed. If the app doesn't respond, Goblin suggests trying Force Quit. Processes that belong to macOS or another user can't be quit from Goblin.
Past ranges#
Choose 1 h or longer and the list changes to Used the most, the 12 apps that used the most over that time, with their average. Goblin records apps in 15-minute steps, so a very recent app may not appear yet; the list then says "No apps recorded for this range yet."
Related alerts#
A processor running flat out shows in the status banner, and an app that keeps it busy in the background raises an alert in Worth a Look. Both are explained on Health and alerts.