 Goblin
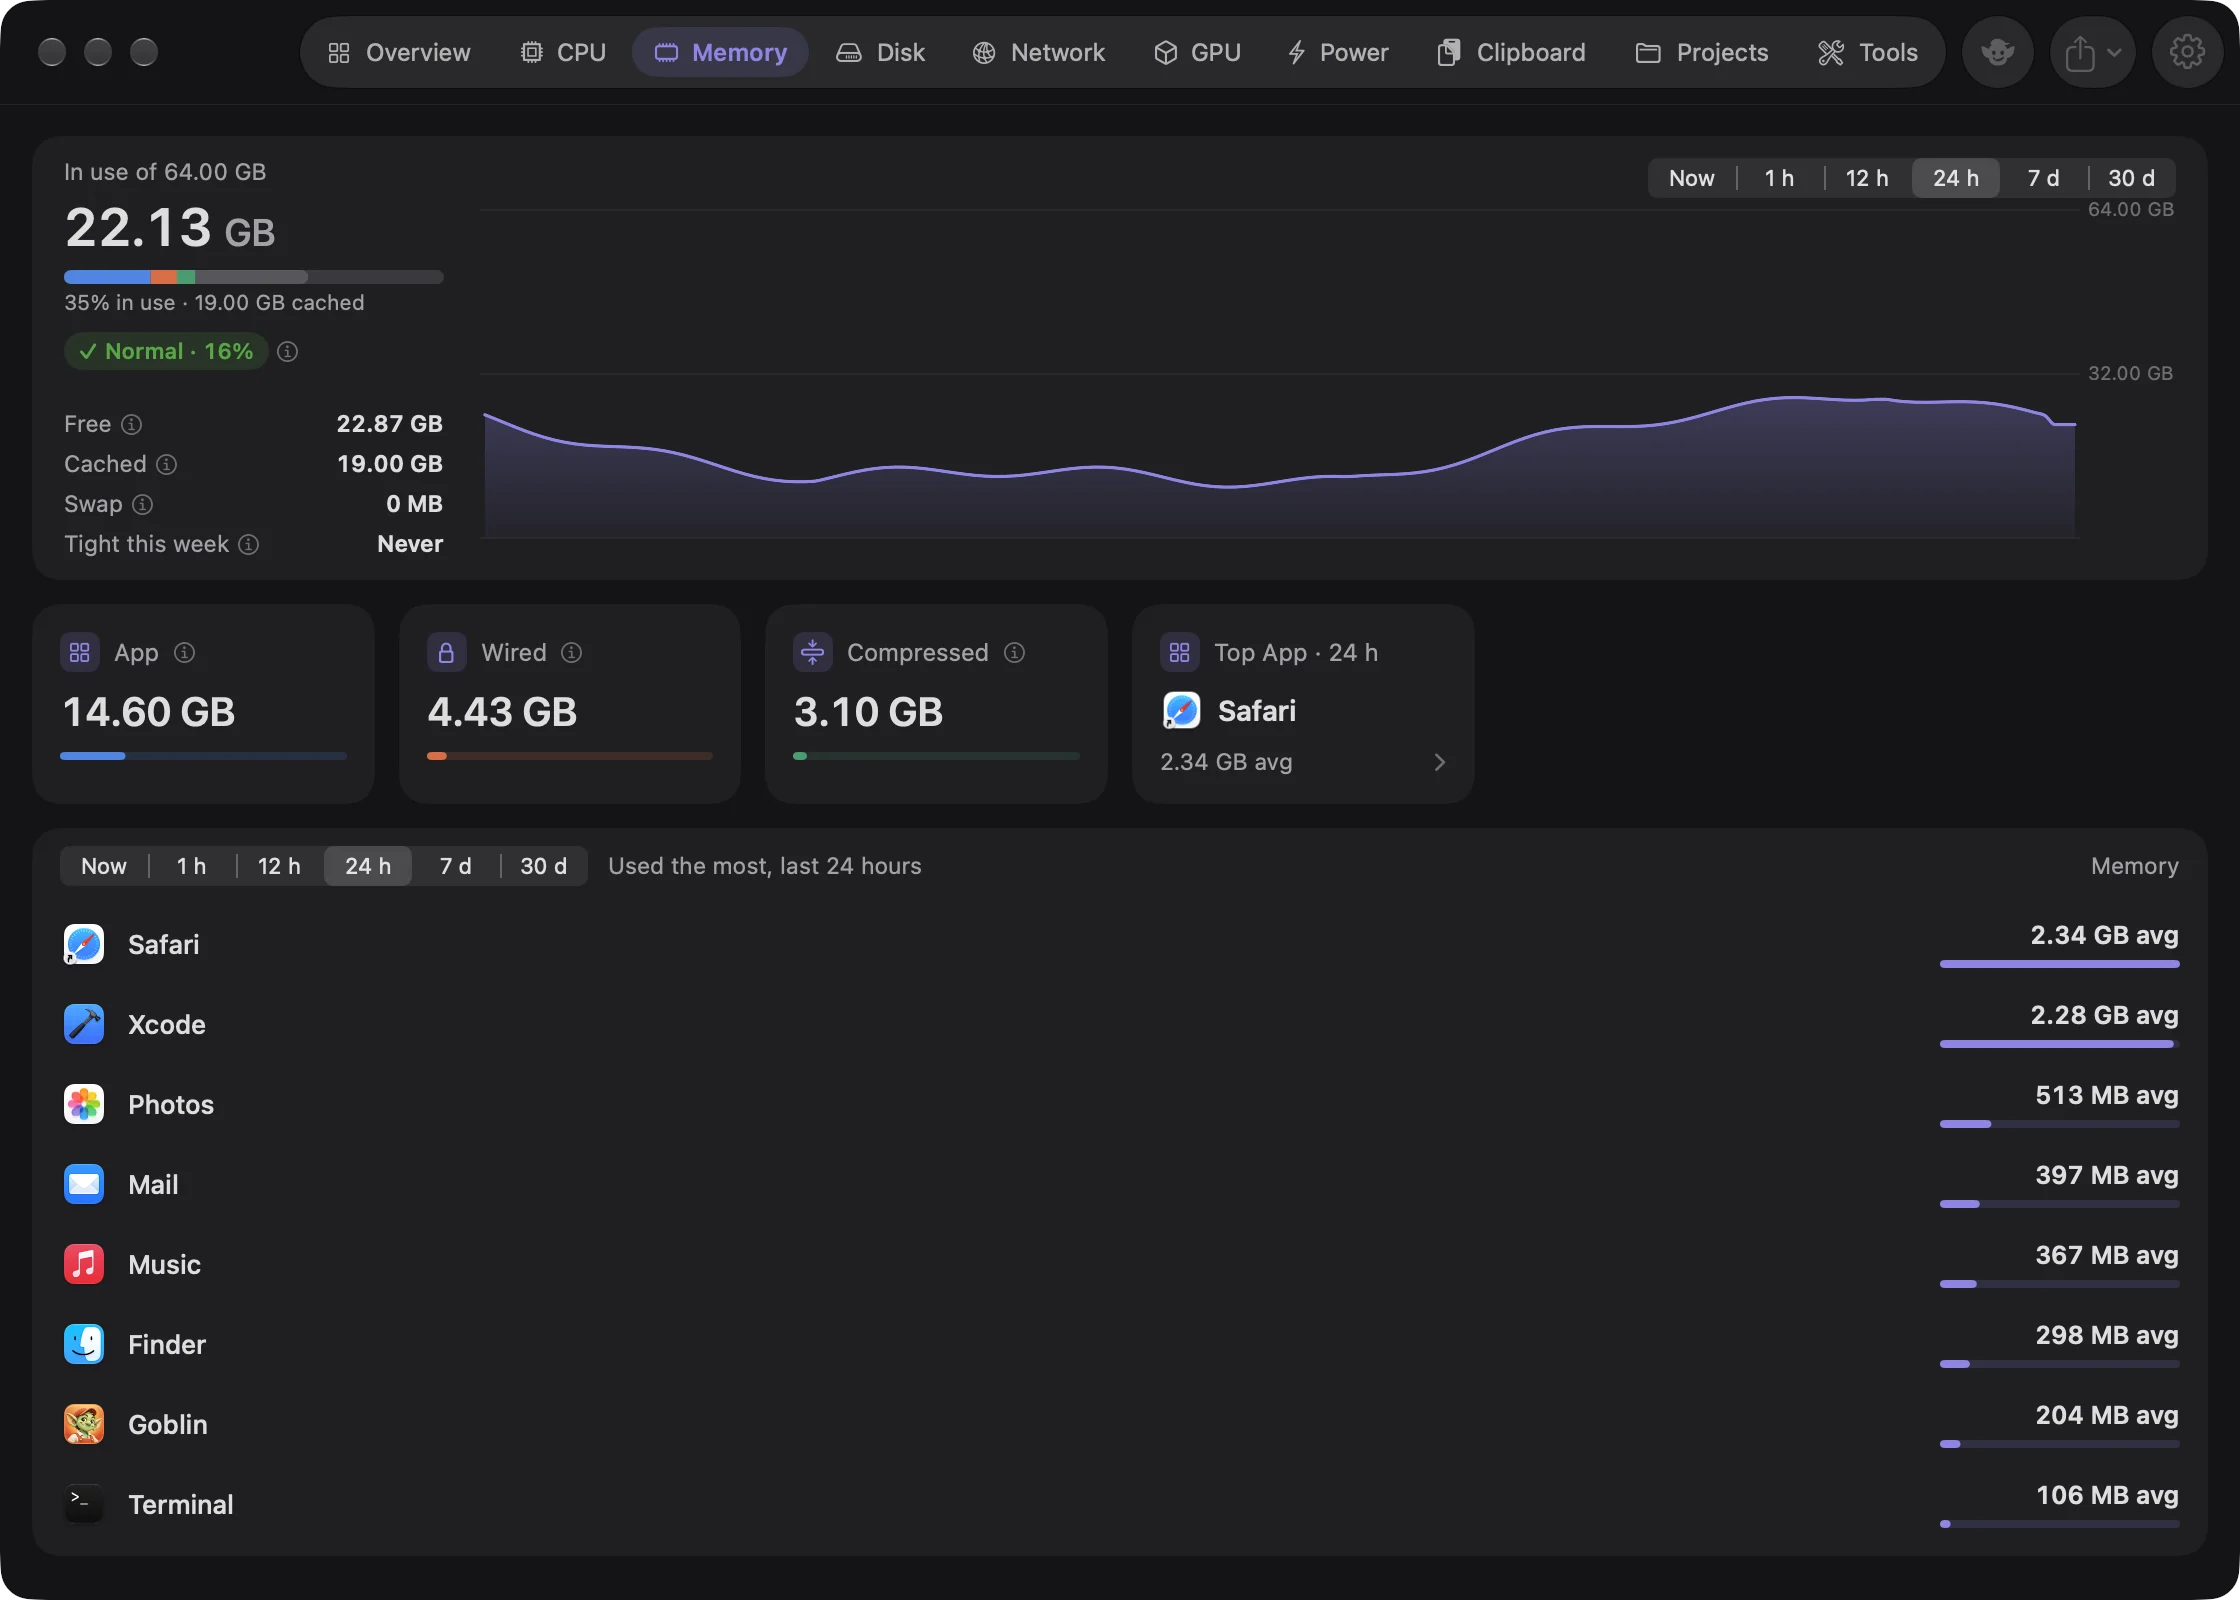
The Memory tab shows how your Mac's memory is being used and which apps hold the most. Memory that looks full isn't a problem on its own: macOS keeps spare memory busy to make things faster, and hands it back the moment an app needs it. What tells you the Mac is short of memory is memory pressure, which this tab puts front and centre.
Check whether your Mac is short of memory#
- Click Memory in the tab bar of the main window, or press ⌘3.
- Look at the chip next to the big figure. It reads Normal, Elevated or Critical.
- If it isn't Normal, scroll to the app list and see what's holding the most.
Normal means you're fine, even if the bar looks full. Elevated and Critical are explained below.
Find the app using the most memory#
- Open the Memory tab (⌘3).
- Look at the Top App card, or scroll to the app list, which is sorted by memory, biggest first.
- Click an app's row to see its processes. Double-click it for its details, or point at it and click ✕ to quit it.
To quit it, see Quit an app from the list.
Memory in use#
The big figure is the memory in use, out of the Mac's total. Goblin counts App, Wired and Compressed memory as in use. The bar under it shows those three, plus Cached memory in a lighter shade, on a track of free memory. The line under the bar gives the share in use and how much is cached, such as "72% in use · 3.1 GB cached".
Memory pressure#
The chip next to the figure reads Normal, Elevated or Critical, followed by a percentage of how hard macOS is working to find memory. These come straight from macOS.
- Normal is fine even when memory looks full.
- Elevated means apps are competing for memory, and macOS is compressing it and moving some to disk. The Mac may start to feel slower.
- Critical means memory is running out.
The rows#
| Row | What it shows |
|---|---|
| Free | Memory nothing is using right now. |
| Cached | Recently used files kept in memory so they open faster. macOS gives this memory to apps as soon as they need it, so it counts as available. |
| Swap | Memory moved out to the disk because there wasn't room. A little is normal; a lot, often, means the Mac would benefit from more memory. |
| Tight this week | How much of the last seven days memory pressure was above normal: Never (under 0.5% of the time) or a share such as "4% of the time". Appears once Goblin has a day of history. |
Click any ⓘ for the explanation. The chart shows memory in use over time, up to the Mac's total. The range buttons above it work as on the CPU tab.
The cards#
| Card | What it shows |
|---|---|
| App | Memory apps are using for their own work. |
| Wired | Memory macOS keeps for itself. It can't be compressed or moved to disk. |
| Compressed | Memory macOS has squeezed to make room. Compressing is quicker than swapping to disk. |
| Top App | The non-macOS app holding the most memory. Click it to open its details. |
Each of the first three has a bar showing its share of all memory.
How Goblin counts#
- App is the memory apps have asked for, less what they've marked as safe to throw away.
- Wired and Compressed are what macOS reports.
- Cached is file data kept in memory, plus memory apps have marked as safe to throw away.
- Free is everything else: the total less what's in use and cached.
The app list#
The list works as on the CPU tab, sorted by memory instead. It includes macOS's own processes, so you can see what macOS itself is holding.
In Apps mode, an app's figure adds up all its processes. Apps can share memory, so the figures for all apps can add up to more than the memory in use. For the same reason the Memory by App card on the Overview shows how many apps are running in its middle rather than a total.
When memory runs short#
Goblin tells you in three ways:
- Memory is tight in the status banner, after memory pressure has been elevated for two minutes.
- Memory is running out, in red, when pressure turns critical. It names the biggest app you aren't using, if quitting it would make a real difference, and offers to quit it.
- macOS is leaning on swap, when swap passes a quarter of your memory while pressure isn't normal.
An app that keeps growing in memory while you aren't using it raises an alert in Worth a Look. All of these, with their exact points, are on Health and alerts.
New in 1.1: You can also ask for a notice once memory in use passes a share you choose, in Settings › Health Check. It's off by default, because macOS keeps memory busy on purpose.
Get a notice when memory use is high#
- Open Settings (⌘,) and click Health Check.
- In the Memory row, tick Worth a look (it reads "off" until you do).
- Use the Percent in use stepper to choose the level, from 50% to 99% in steps of 5.
The check also needs the Memory switch on the right of the row to be on, which it is by default.