 Goblin
The GPU tab shows the graphics processor: the part of the Mac that draws the screen, plays video and runs games, and that many creative and AI apps use for heavy work. Look here when animations stutter, video exports are slow, or the Mac is warm and the CPU isn't the reason.
See which apps are using the graphics processor#
- Click GPU in the tab bar of the main window, or press ⌘6.
- Read the big figure: how busy the graphics processor is right now.
- Look at the Top App card, or scroll to the app list, which is sorted by each app's share, biggest first.
When it worked, you see the app doing the work. Click an app's row to open its processes, or double-click it for its details.
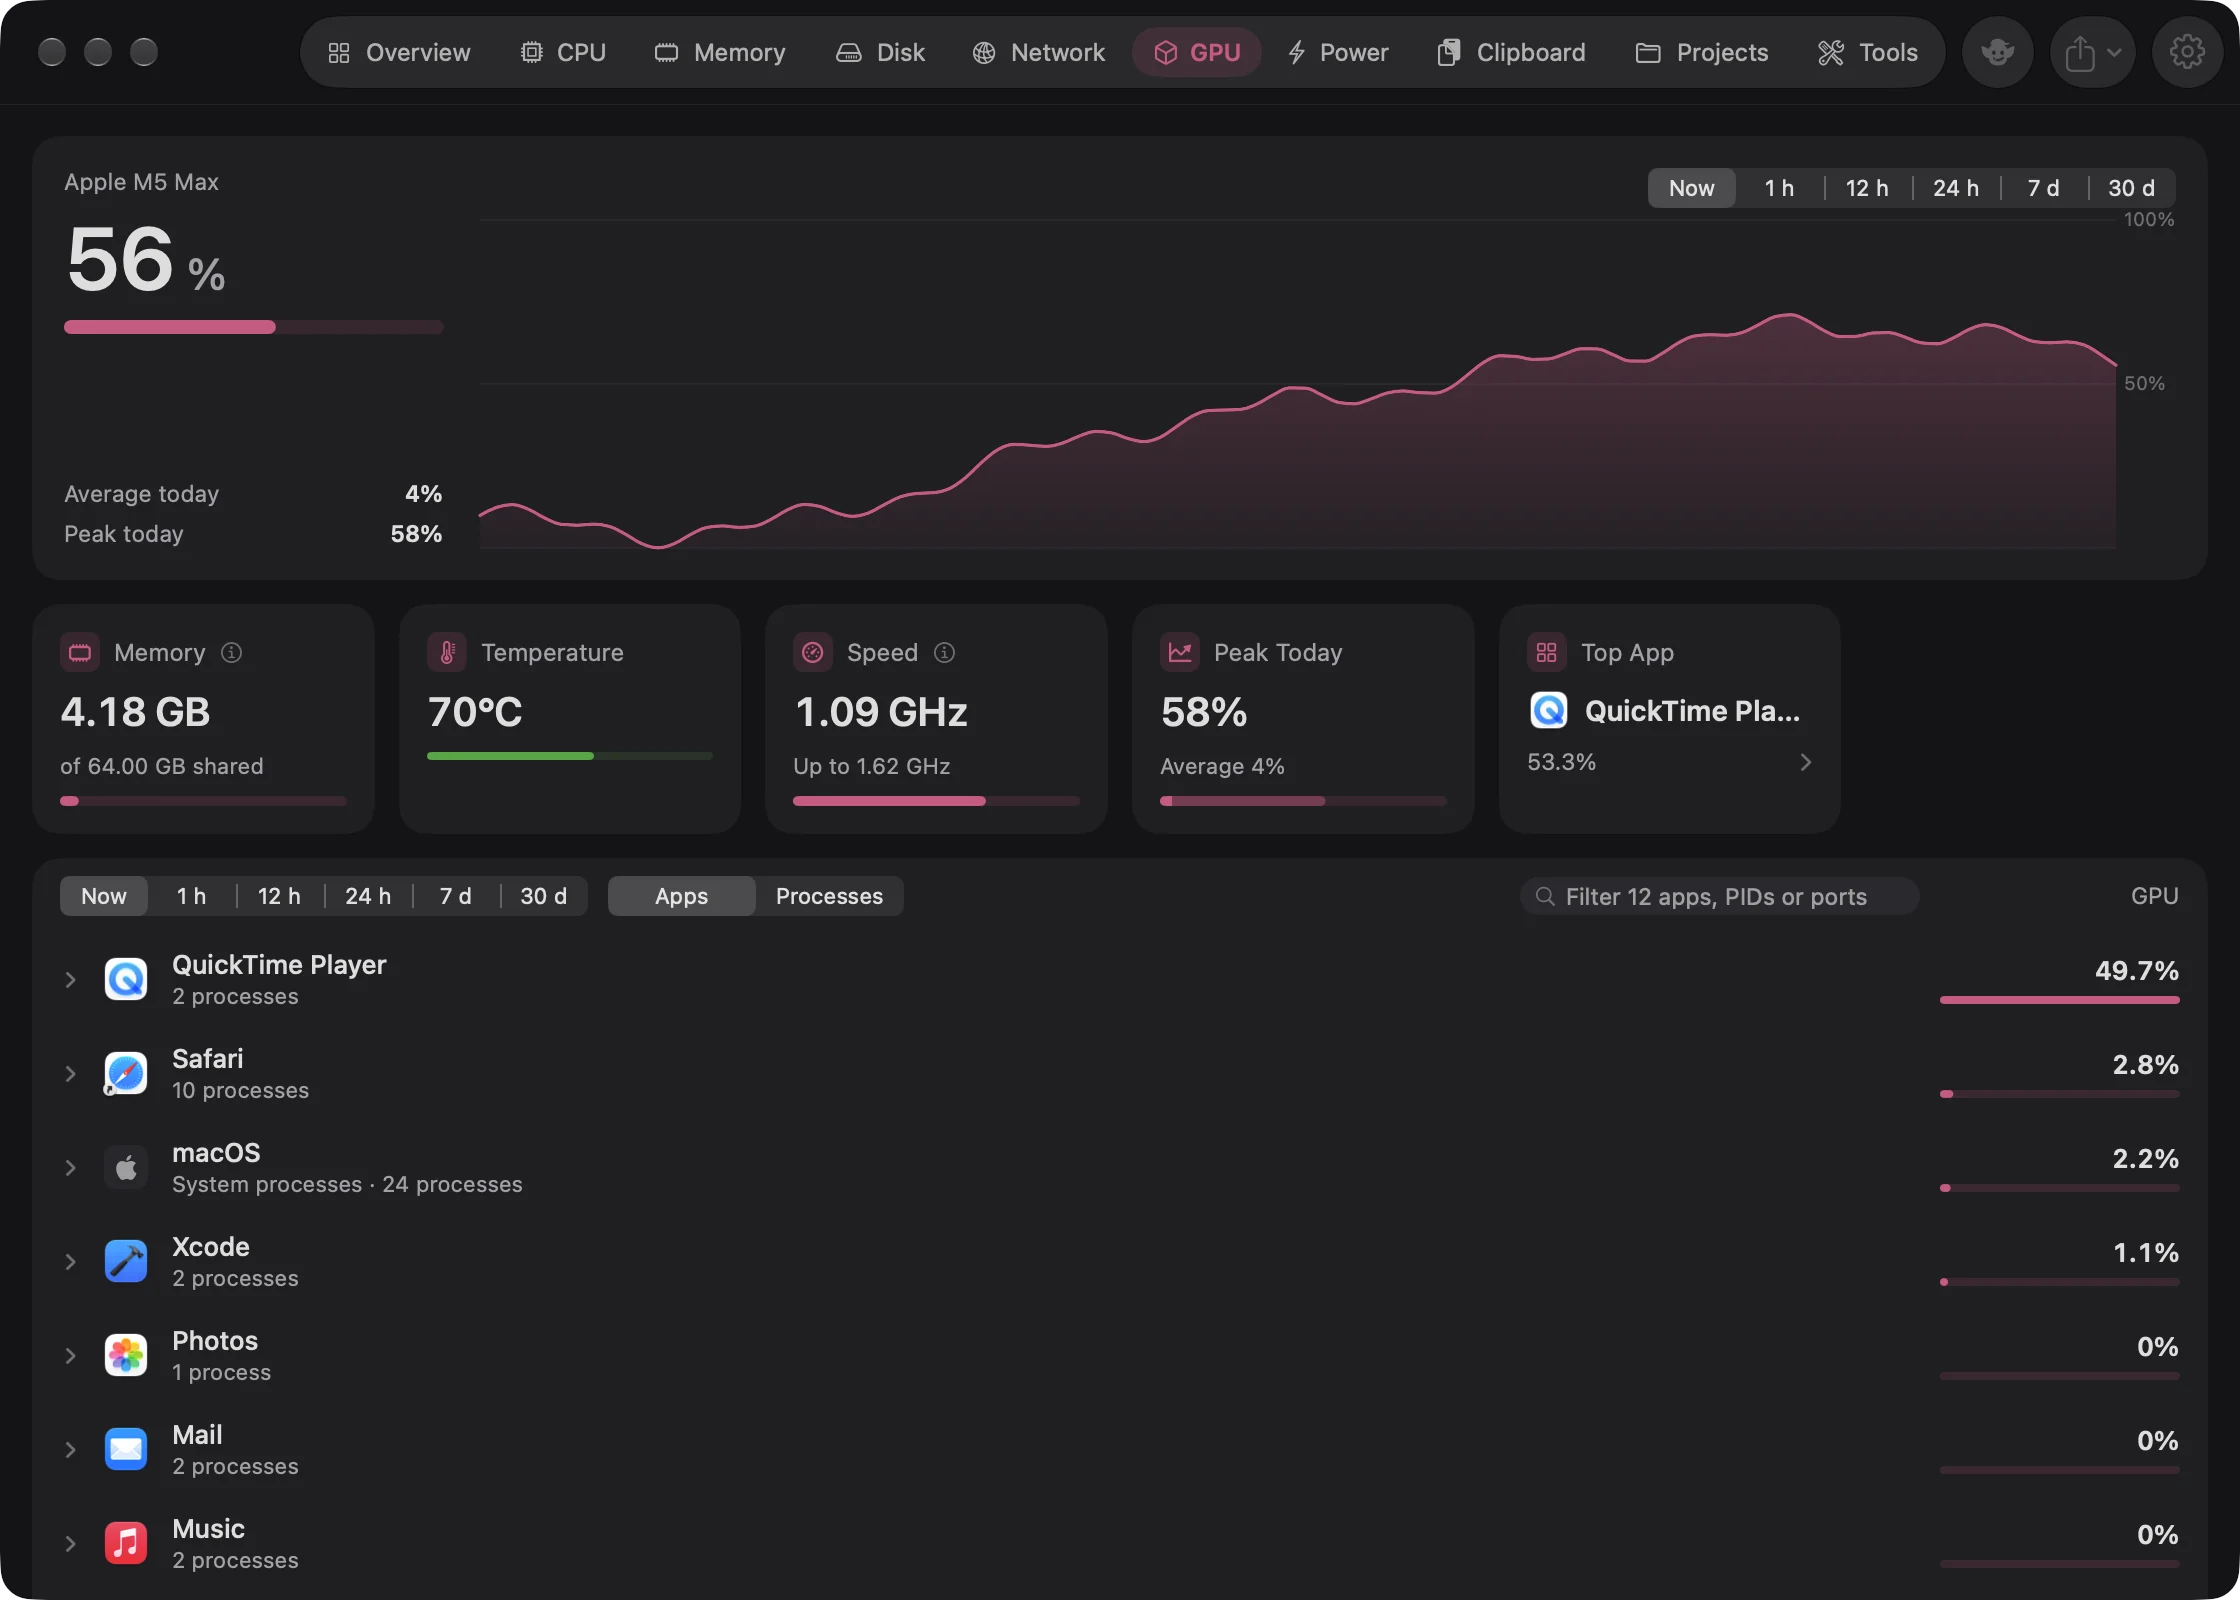
The graphics processor now and over time#
The card is captioned with the graphics processor's name, or "Graphics" if macOS doesn't give one. The big figure is how busy it is right now, and the bar turns red at 90%. If the Mac doesn't report it, the figure reads "—".
| Row | What it shows |
|---|---|
| Average today | Average use since midnight. |
| Peak today | The busiest it has been since midnight. |
The chart and its range buttons work as on the CPU tab.
The cards#
| Card | What it shows |
|---|---|
| Memory | Memory the graphics processor is using, with a bar against all your Mac's memory. On Apple silicon it shares the Mac's memory, so the note reads, for example, "of 16 GB shared". |
| Temperature | The graphics processor's temperature, colored green, orange or red. "—" if the Mac doesn't report it. |
| Speed | How fast the graphics processor is running now, or Idle, with its top speed under it. Only on Macs that report it. |
| Peak Today | Today's peak, with today's average in the note and the bar. |
| Top App | The app using the graphics processor most, apart from macOS. Click it to open its details. |
Temperatures and the colors they turn are explained in Thermals.
The app list#
The list works as on the CPU tab, sorted by each app's share of the graphics processor. macOS doesn't always add these shares up exactly, so Goblin scales them down where needed: all the apps together never show much more than the graphics processor's total. App figures refresh every 3 seconds while the window is open.
When the graphics processor is flat out#
New in 1.1: When the graphics processor averages 90% or more for about a minute, the status banner says The graphics chip is working flat out, naming the app behind most of it if one is using at least 20%. You can change the share, or leave the check out, in Settings › Health Check.
See Health and alerts for everything else the health check looks at.